Studies
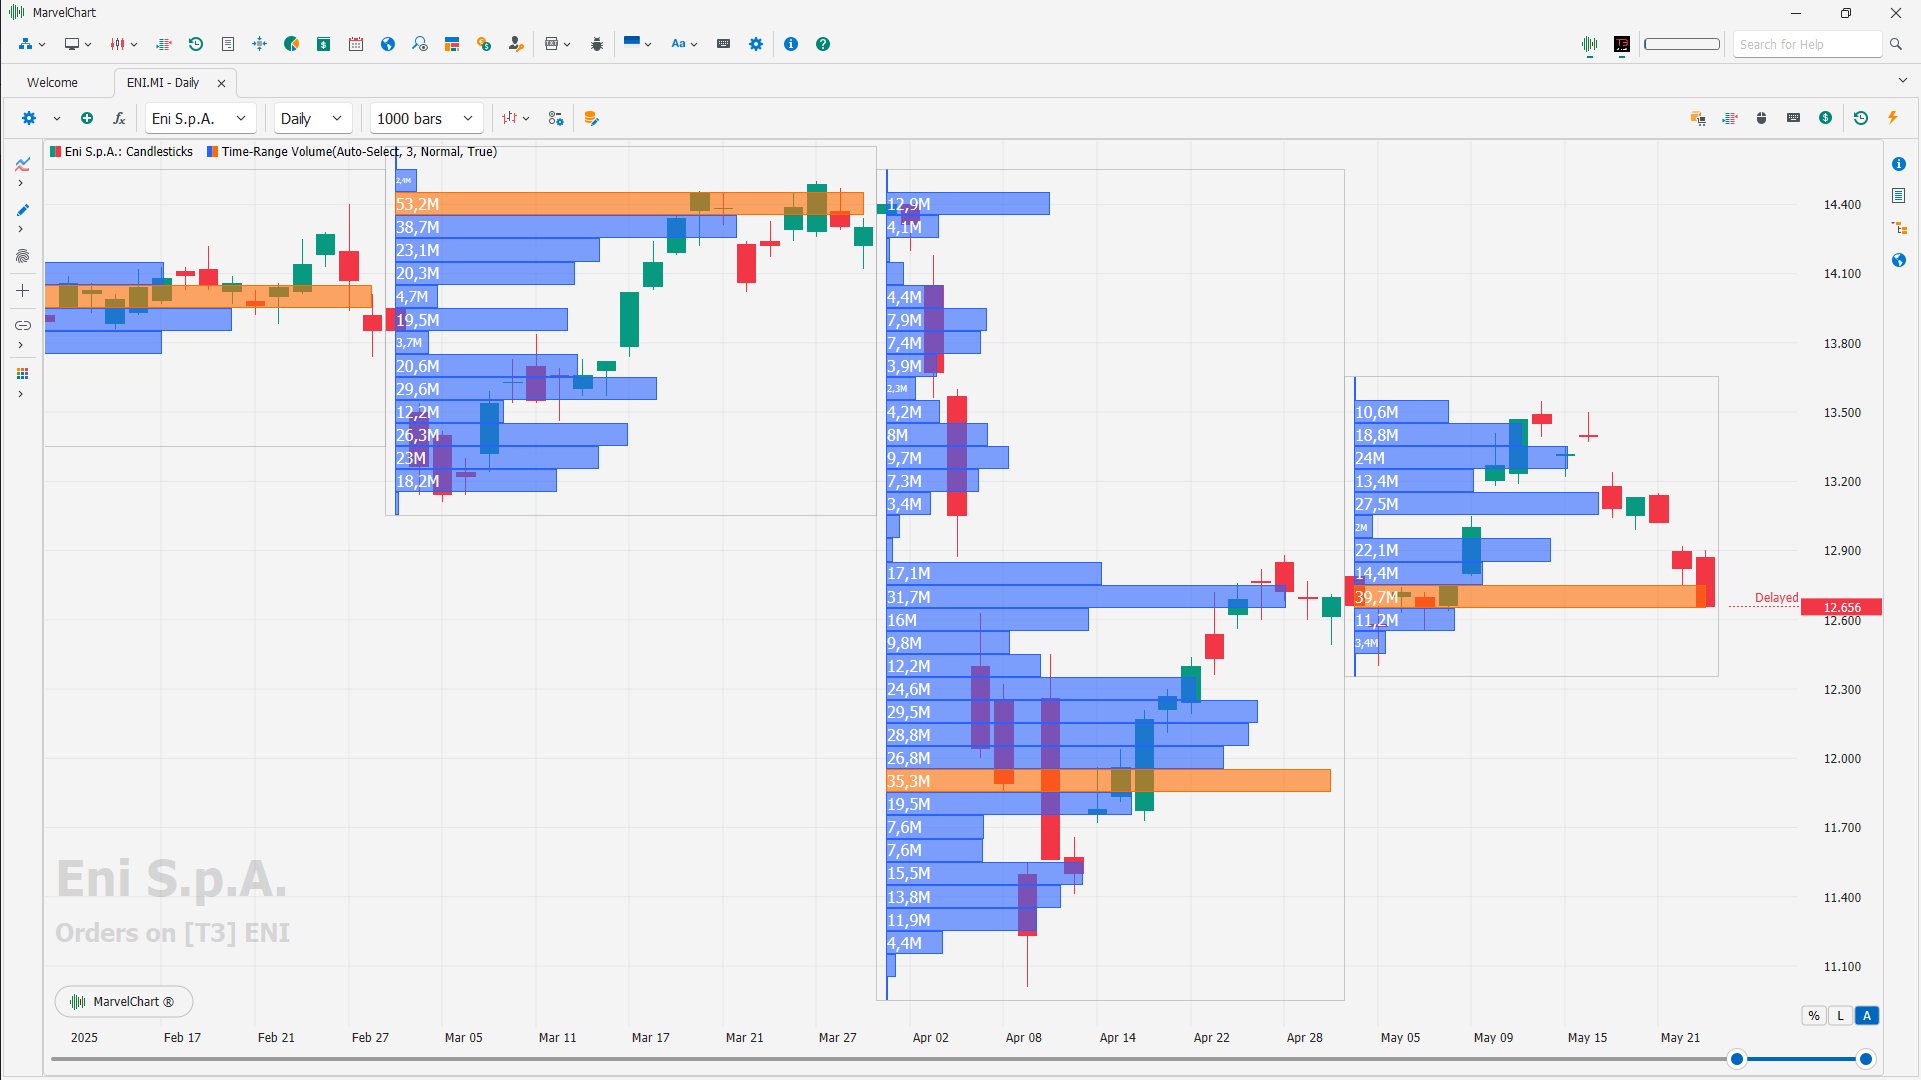
Time-Range Volume

The Time-Range Volume indicator uses historical volume data as the basis for calculation and drawing. It is represented by groups of horizontal histograms, whose Y coordinate represents the price at which the volumes were traded, while the length of the histogram represents the sum of the volumes traded at that price. Each group of histograms constitutes a time interval, whose size is always greater than the TimeFrame of the Chart, to aggregate the volumes of a sequence of historical bars in a group of histograms. It can be used profitably with any TimeFrame.
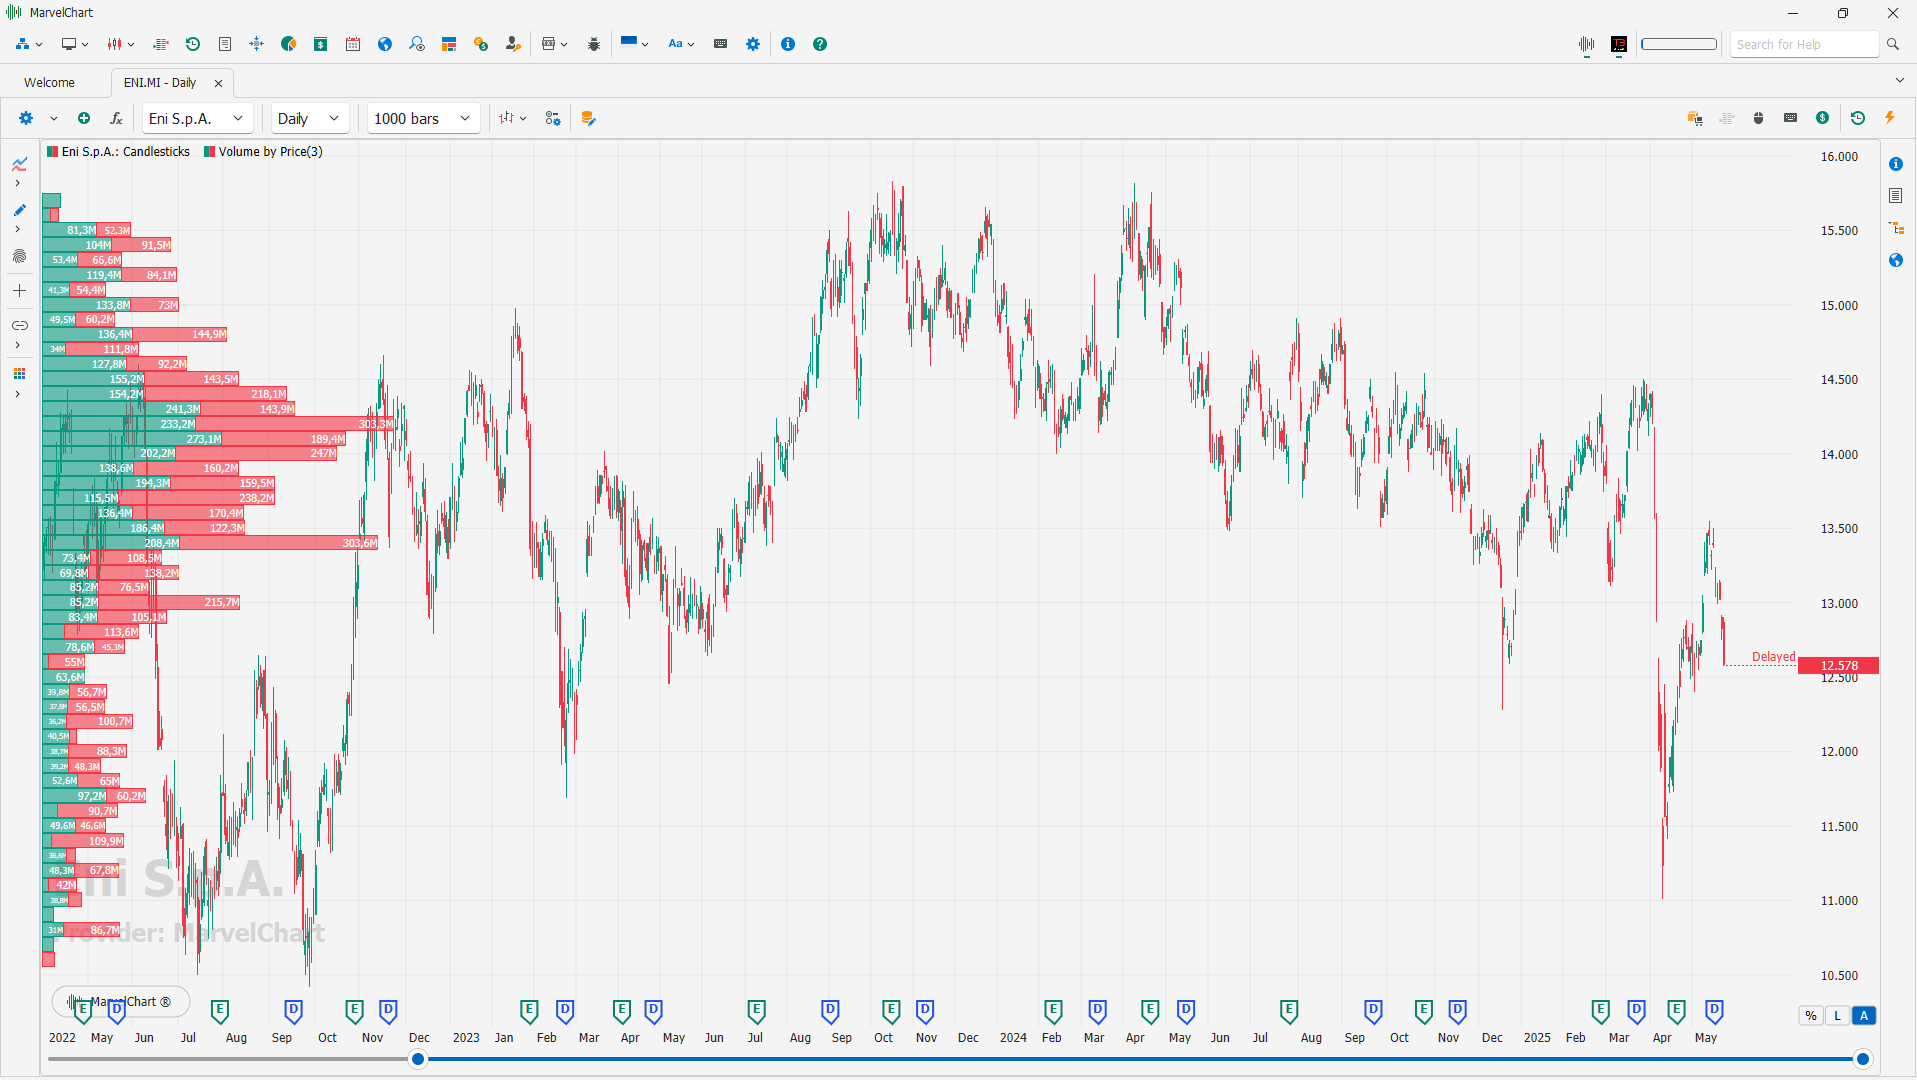
Volume By Price

The Volume By Price indicator is represented by horizontal histograms, whose Y coordinate represents the price at which the volumes were traded, while the length of the histogram represents the sum of the volumes traded at that price. For each price level there are two distinct histograms, one for the Buy direction and the other for the Sell direction. The direction is determined by the Open and Close prices of the historical bars, Buy for bars where Close is greater than Open, Sell for bars where Close is less than Open. The two histograms are added together to also display the total volume traded at that price level. It can be used profitably with any TimeFrame.
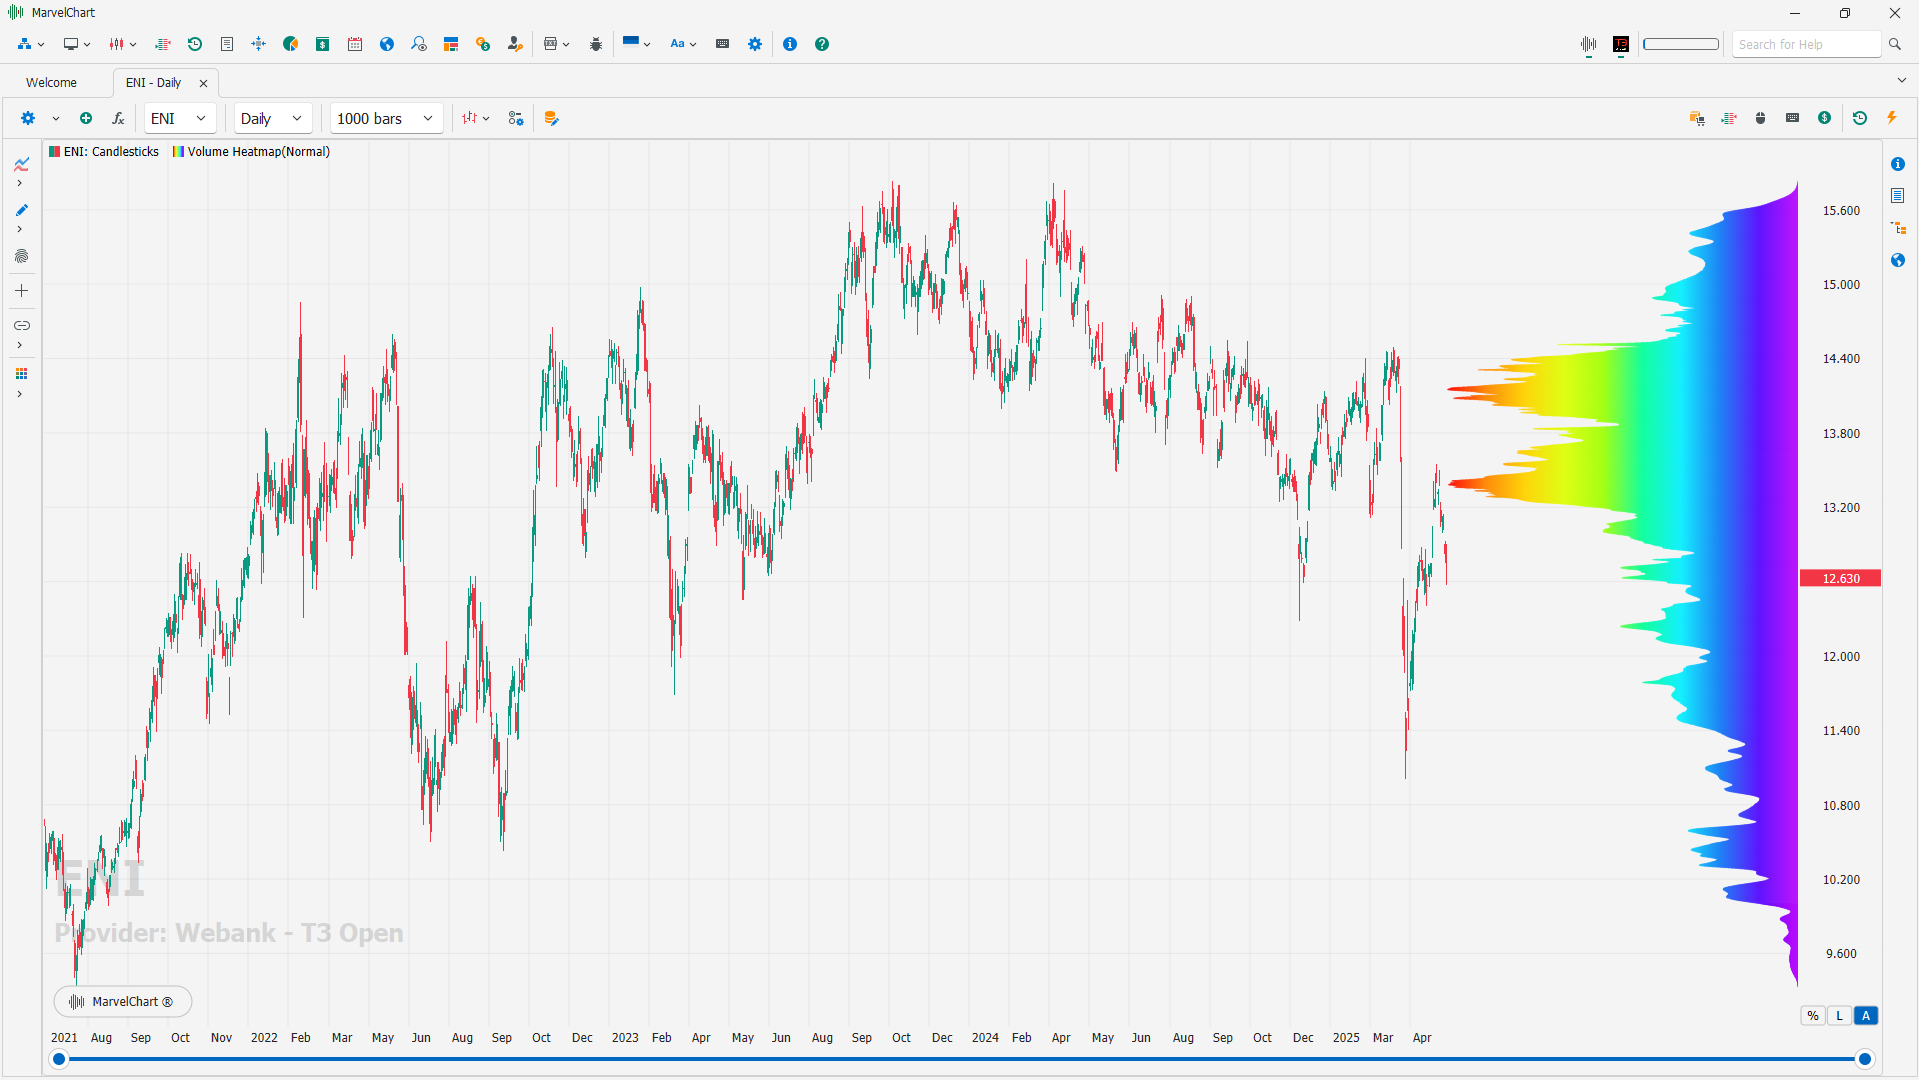
Volume Heatmap

This indicator is represented by horizontal histograms, whose Y coordinate represents the price at which the volumes were traded, while the length of the histogram represents the sum of the volumes traded at that price. It can be used profitably with any TimeFrame.