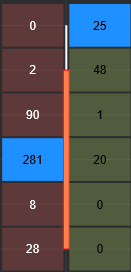
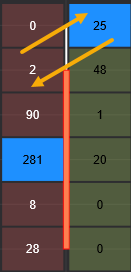
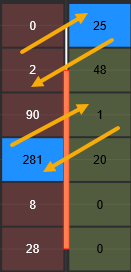
Overlap
Absorption
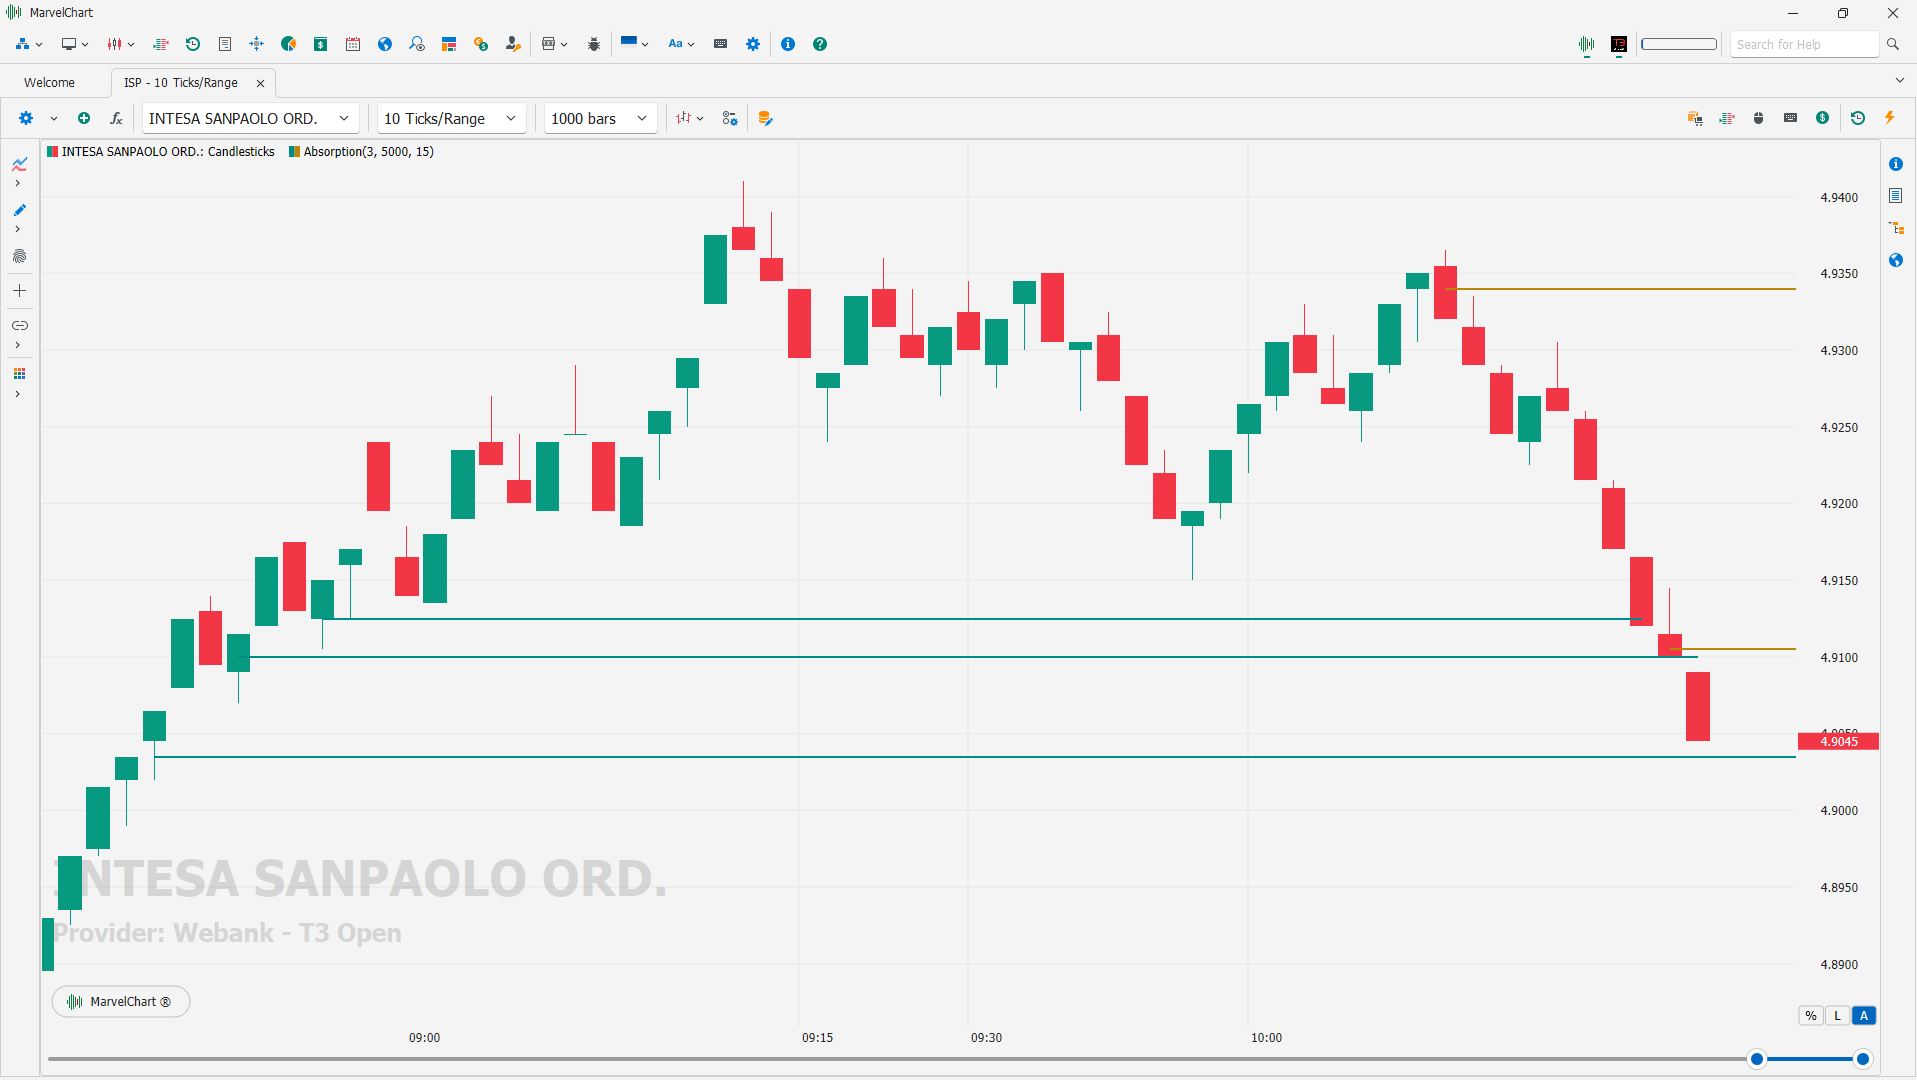
The indicator analyzes footprint data and identifies absorption levels using the imbalance method, where significant order volumes indicate potential support or resistance zones.
Bar's Volume Filter
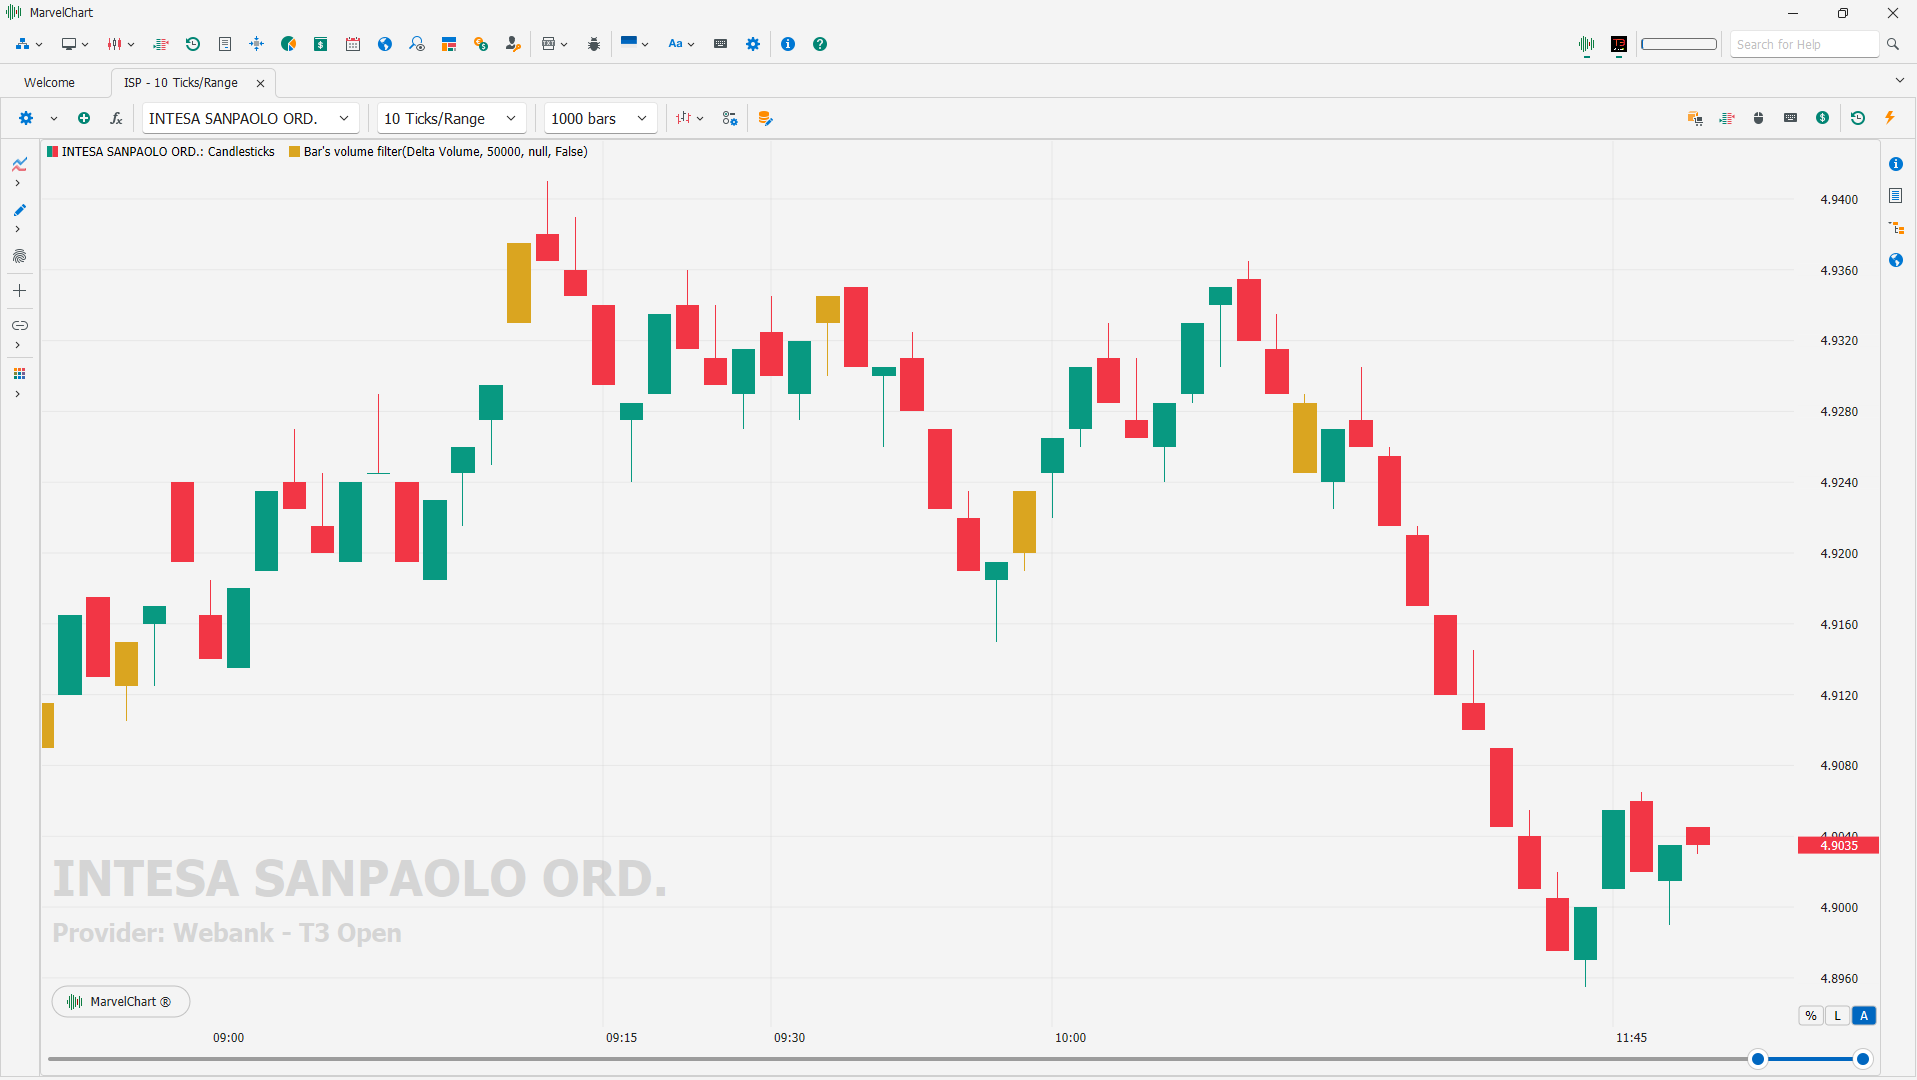
The Bar's Volume Filter indicator is a tool for filtering the volume of candles on the chart. It allows users to define criteria for showing or hiding candles based on volume and time. This indicator highlights bars on the chart based on their volume characteristics and optional time filters. Bars that meet the specified criteria are colored with the user-defined color, while others remain transparent.
Big Trades
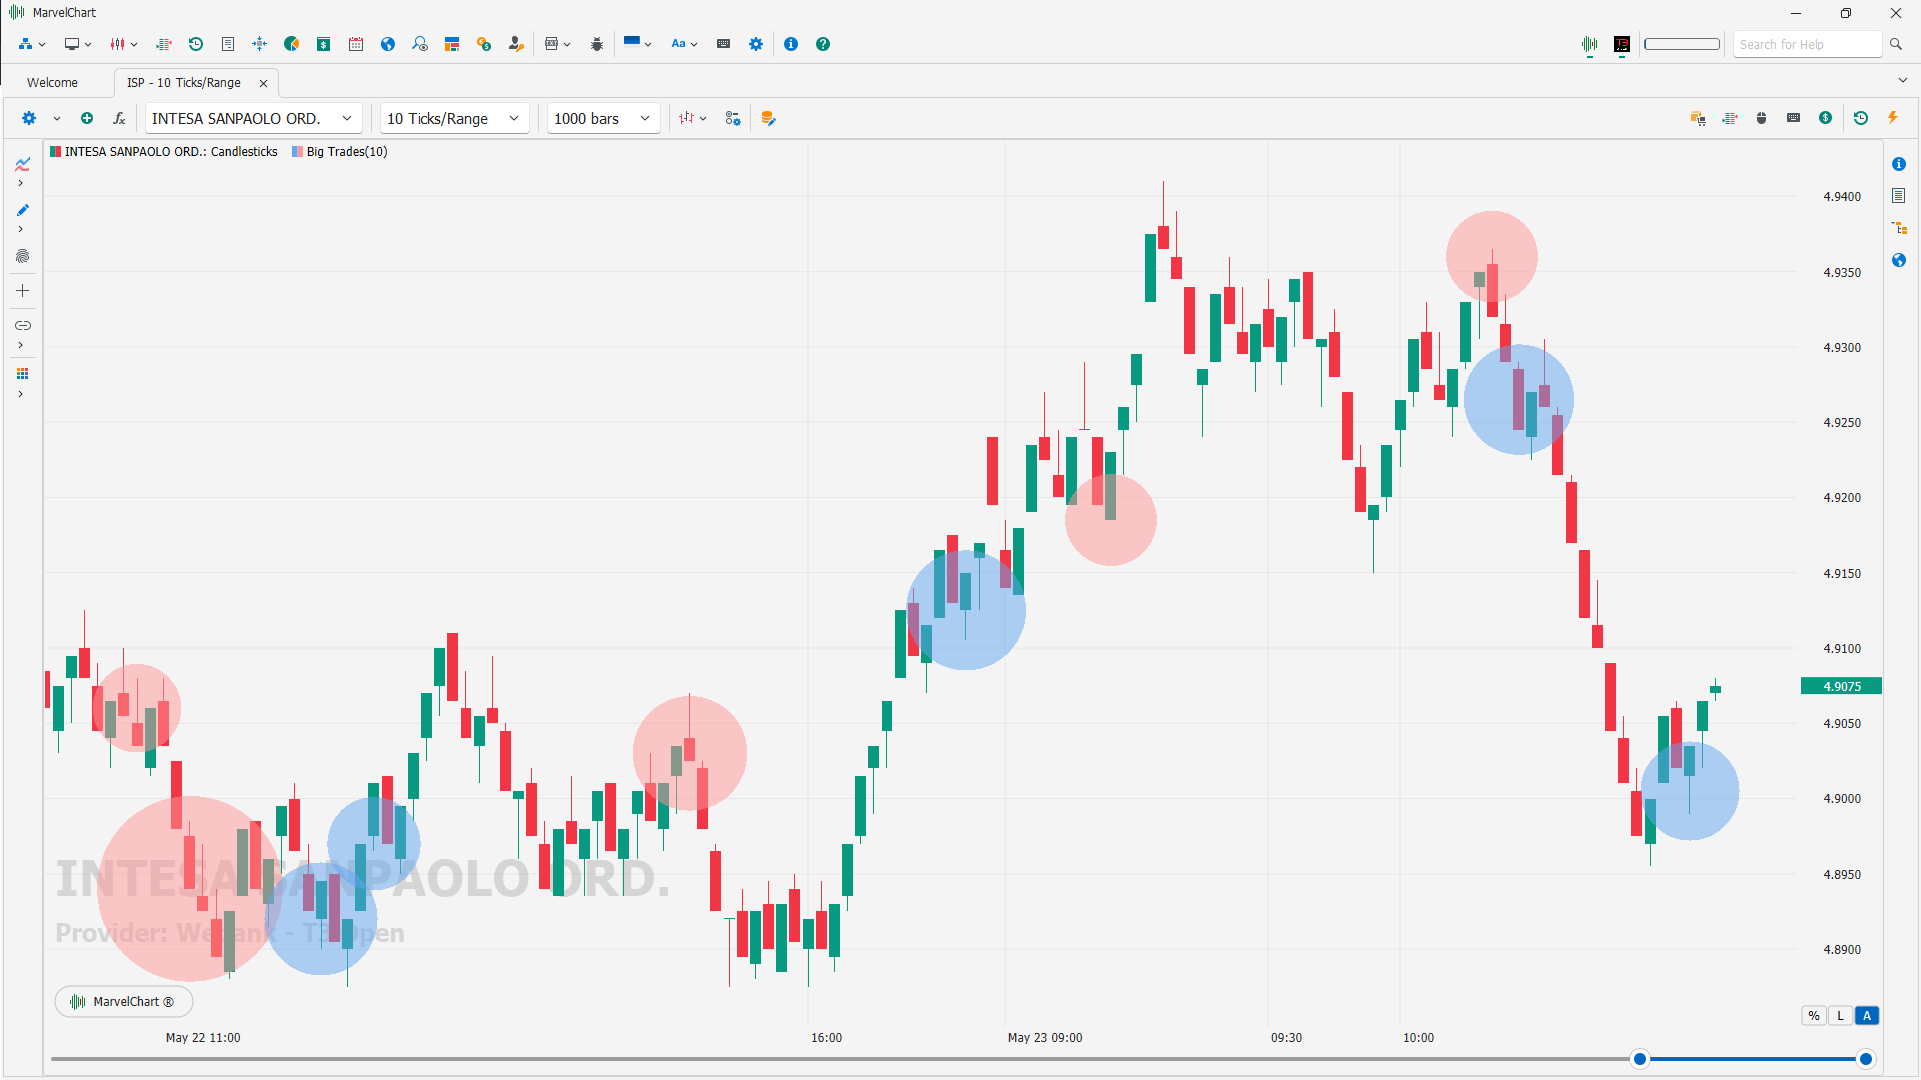
The Big Trades indicator shows aggregated trades without applying any filters. The displayed data adapts to the current scale and visible area of the chart to show the top 10 volumes.
Delta Pivot Points
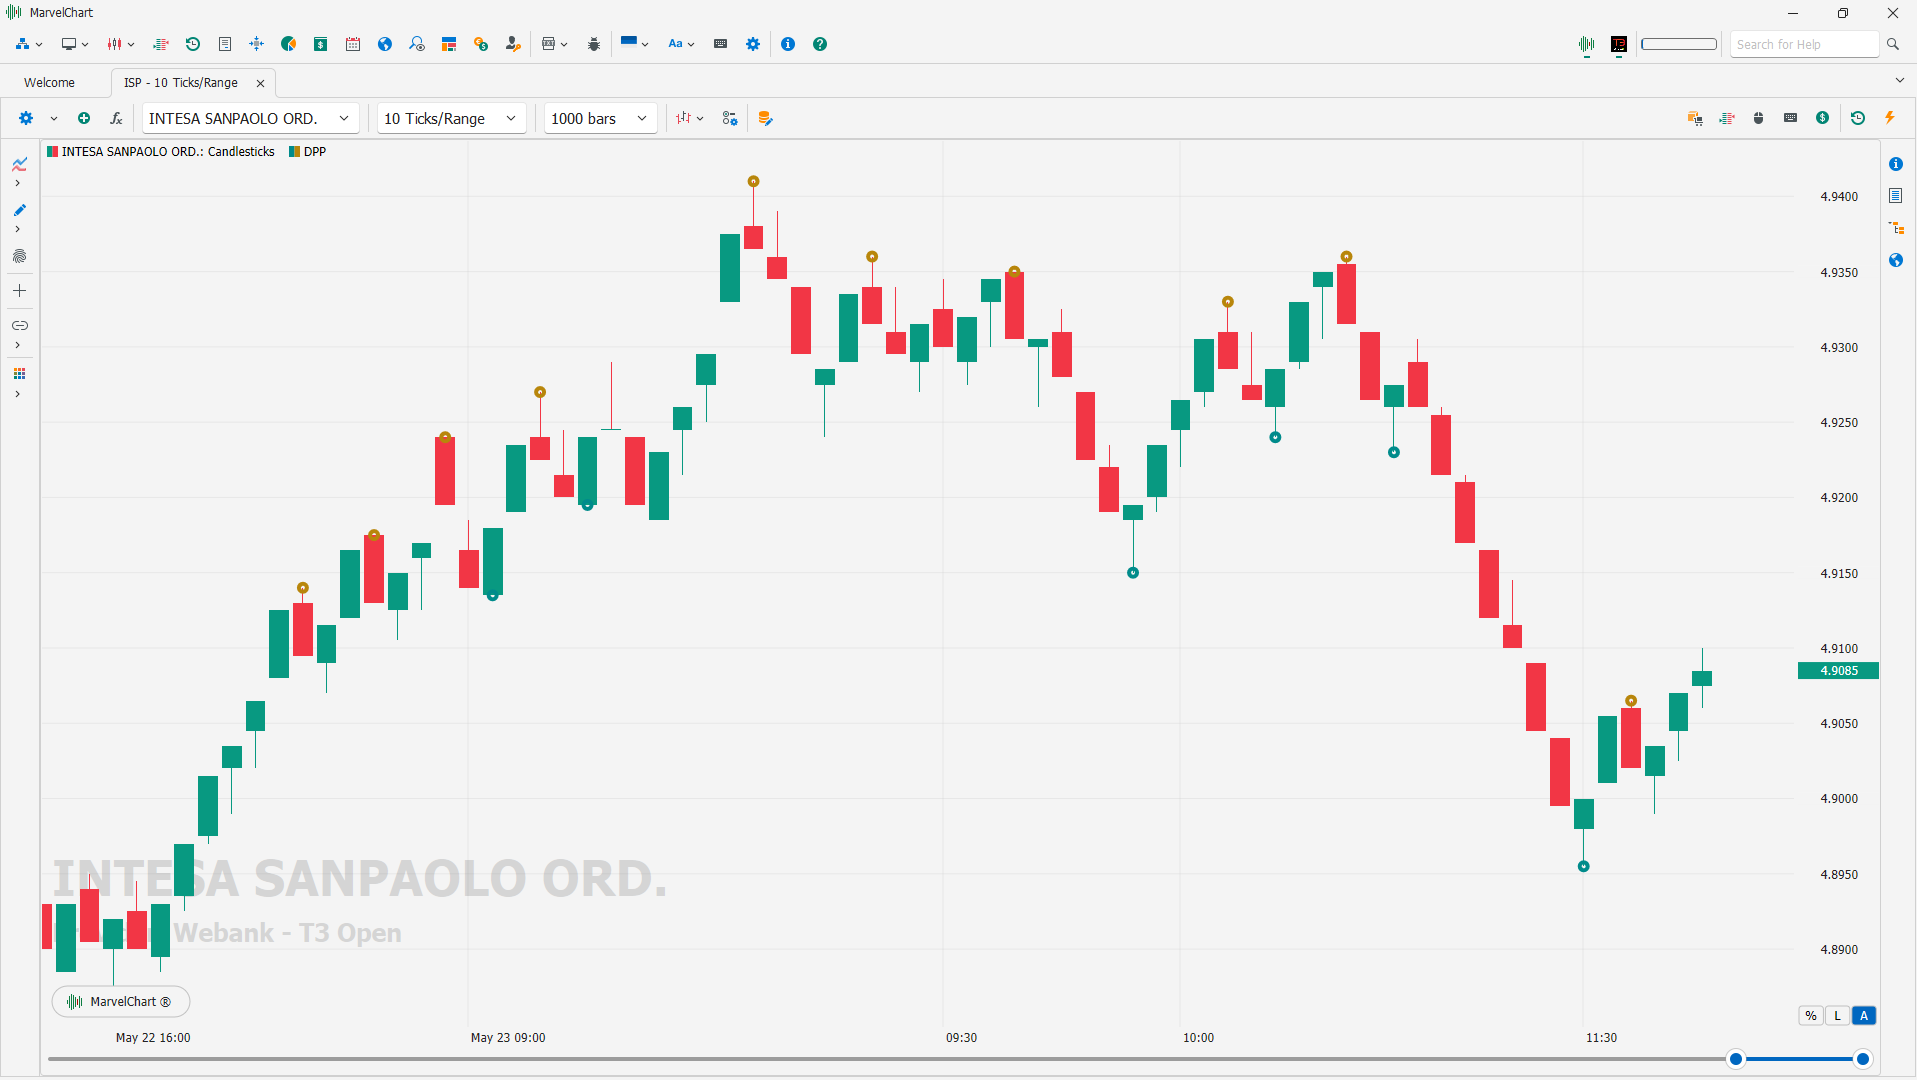
Delta Pivot Points displays potential pivot points in the chart.
Conditions for bullish pattern:
Two consecutive bearish candles;
The third candle is bullish;
Low of the bullish candle is less than or equal to the low of the previous candle;
Delta of the bullish candle is positive.
Conditions for bearish pattern
Two consecutive bullish candles;
The third candle is bearish;
High of the bearish candle is greater than or equal to the high of the previous candle;
Delta of the bearish candle is negative.
Delta Volume Profile
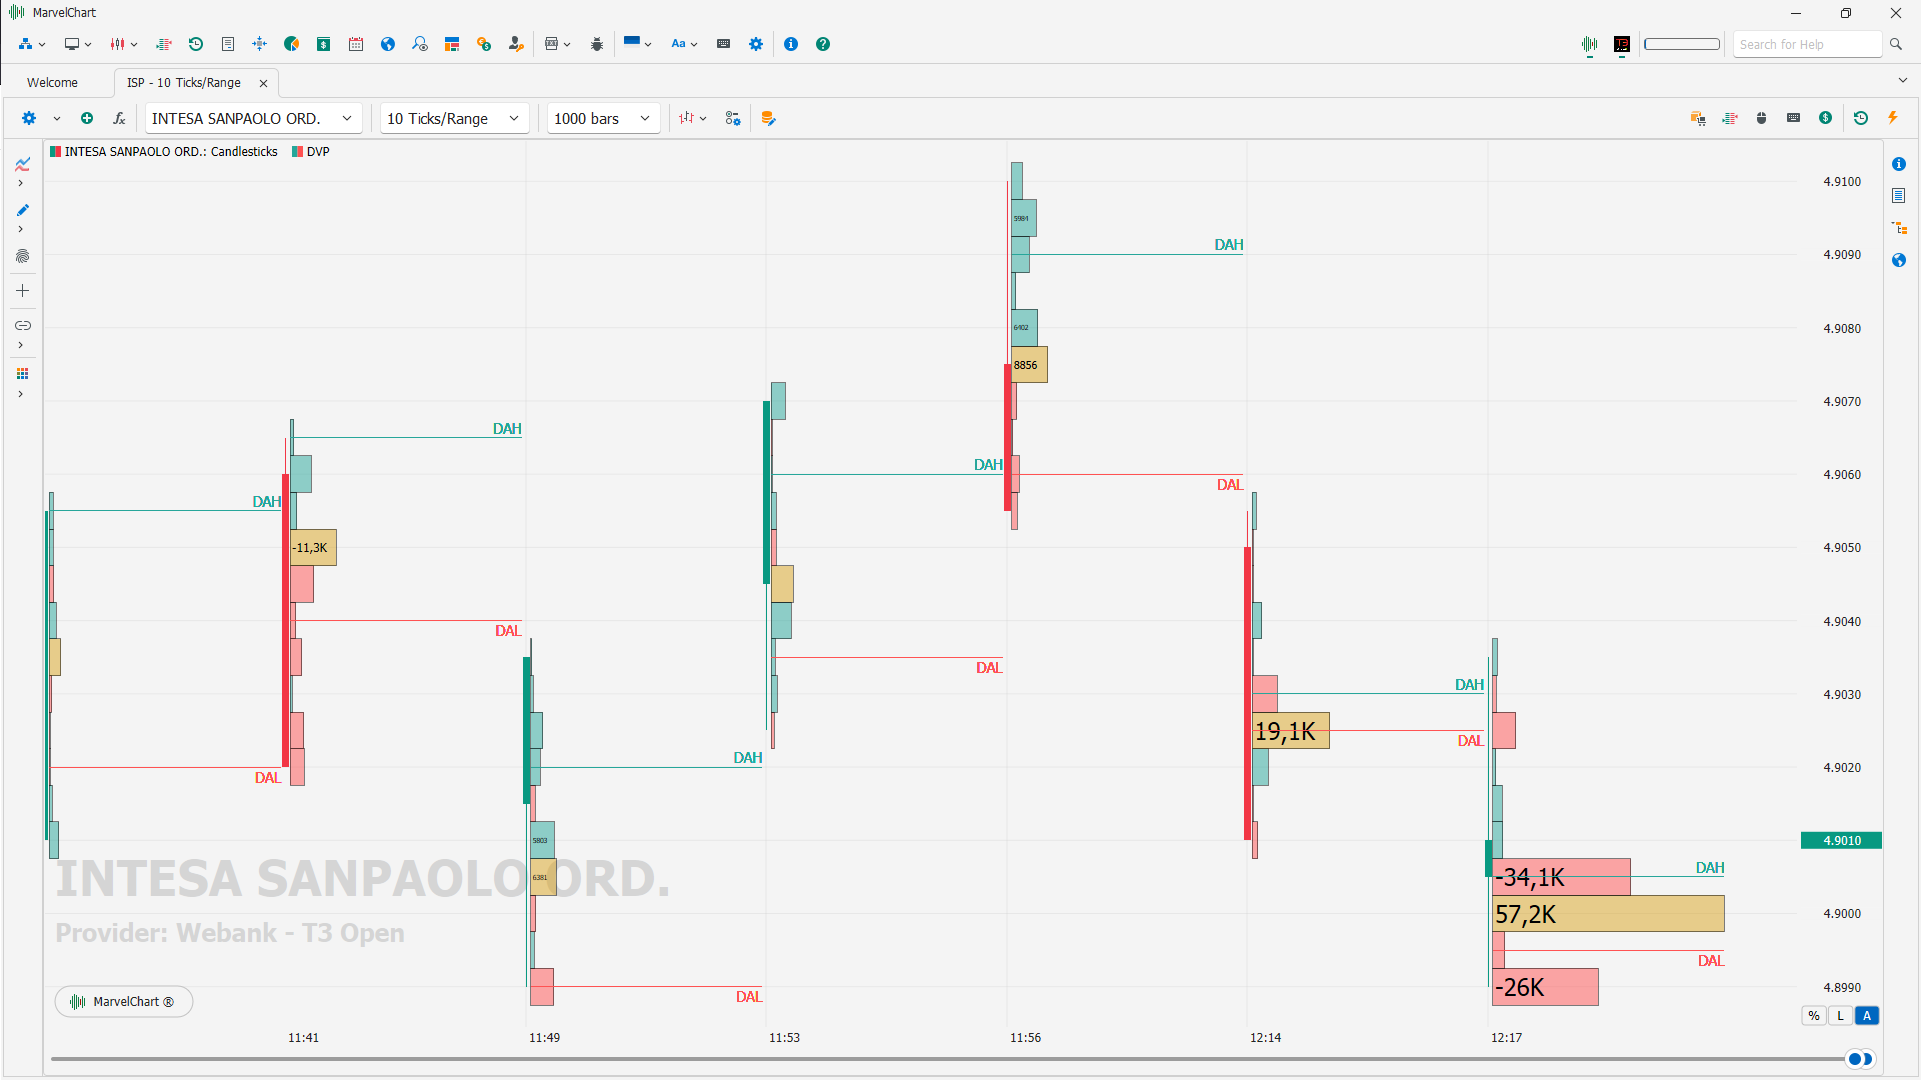
A Delta Volume Profile is a type of Volume Profile that highlights the difference between buying and selling volumes at each price level. It's essentially a volume profile that shows the delta (difference) between ask (selling) and bid (buying) volumes, rather than the total volume. This helps traders identify areas of market imbalance and potential support/resistance levels.
What it is
Volume Profile: A visual representation of the volume traded at different price levels;
Delta: The difference between the volume traded at the ask (selling) price and the volume traded at the bid (buying) price;
Delta Volume Profile: A volume profile where the bars are based on the delta, not the total volume.
How it works
Positive Delta: Indicates more buying pressure than selling pressure, suggesting potential bullish sentiment;
Negative Delta: Indicates more selling pressure than buying pressure, suggesting potential bearish sentiment.
Interpreting the Profile
Areas with a high delta (positive or negative) indicate strong imbalances. These imbalances can be used to identify potential support or resistance levels, and to anticipate potential price movements.
How it's used
Identifying Key Levels: Delta profiles can help traders identify areas of strong support and resistance based on where imbalances in buying and selling volumes have been concentrated.
Understanding Market Sentiment: By analyzing the delta at different price levels, traders can gain insight into the dominant sentiment (bullish or bearish) at that price.
Predicting Potential Reversals: If the price returns to an area of significant delta imbalance, it may be an indicator of potential further movement in the direction of the dominant side.
Combining with other tools: Delta profiles can be used in conjunction with other technical analysis tools, such as price charts, volume profiles, and order flow data, to gain a more comprehensive understanding of market dynamics.
Example
If a delta volume profile shows a large positive delta at a certain price level, it suggests that more buying volume occurred at that level than selling volume. This could indicate that the price may find support at that level, as buyers may be willing to absorb any selling pressure at that price.
Depth Of Market
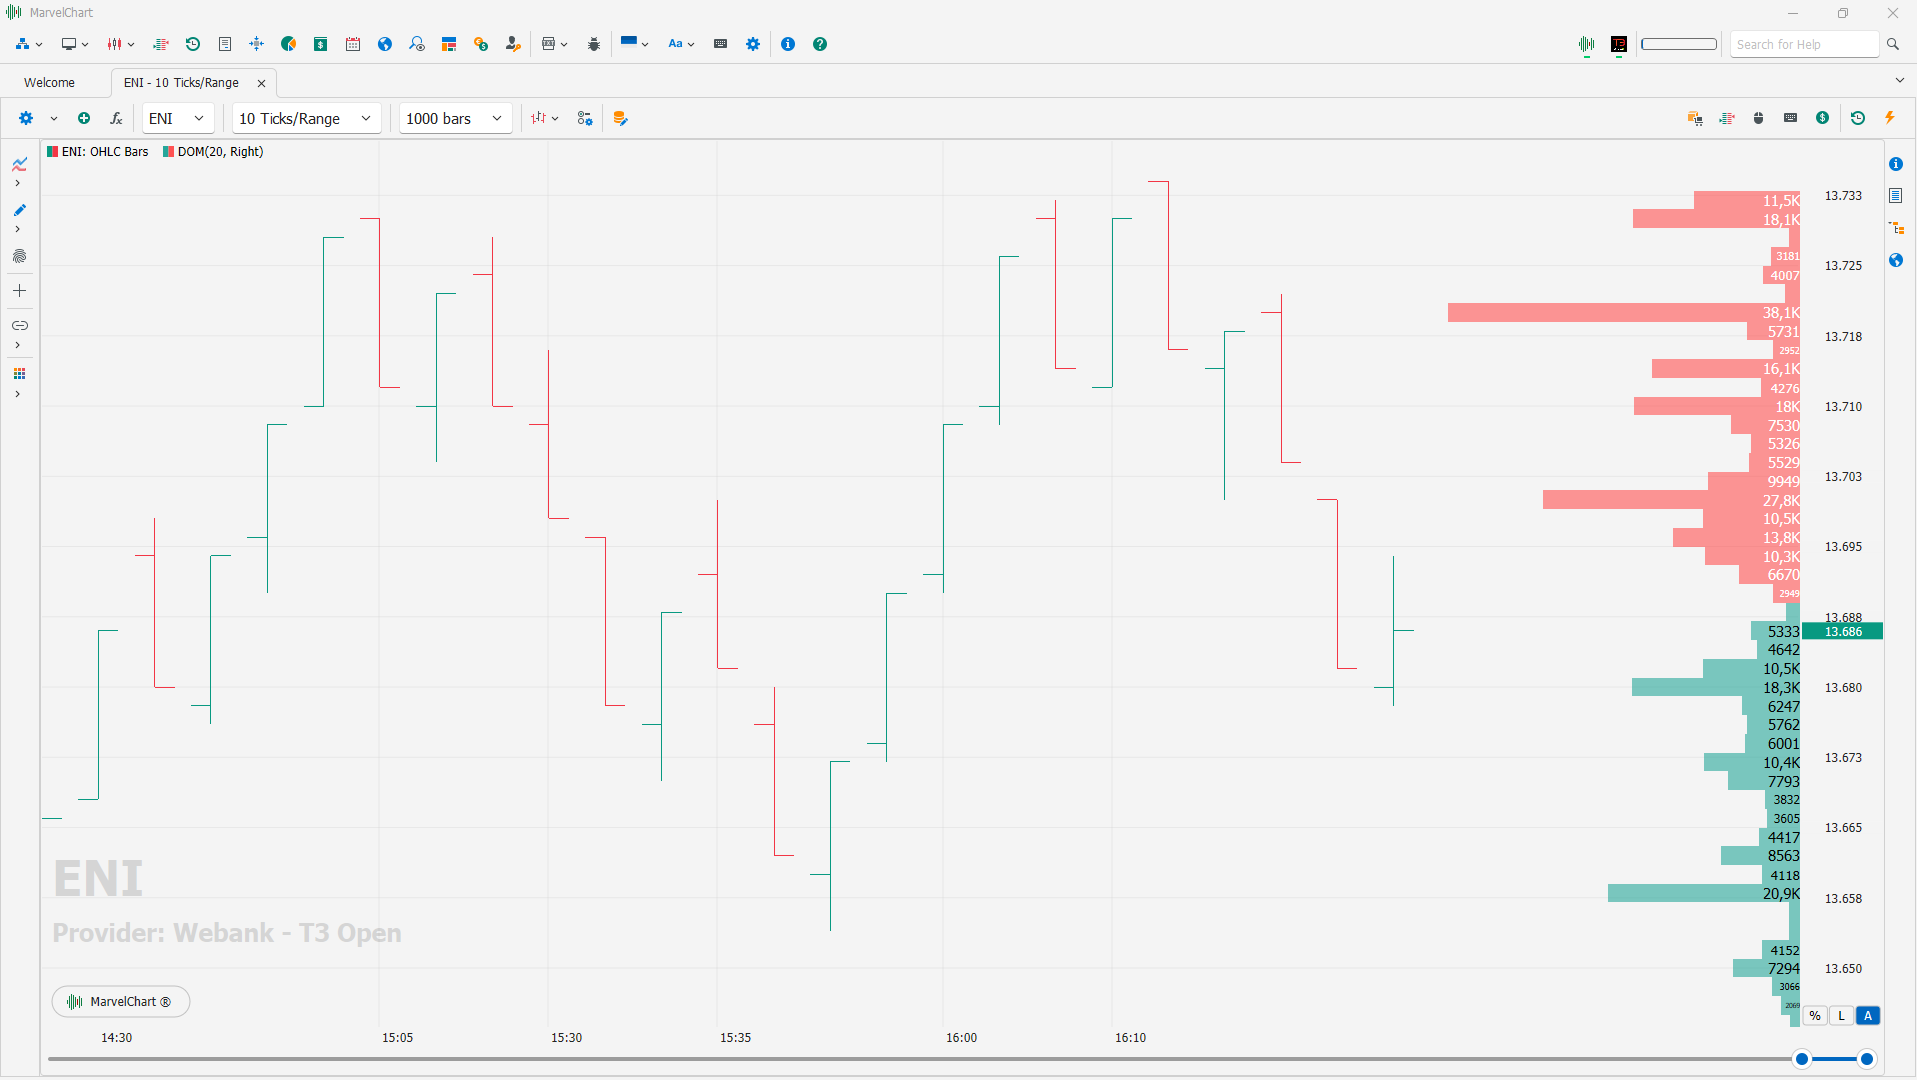
The Depth Of Market indicator displays the current bid and ask levels and their volumes in real time.
Dynamic Levels Channel
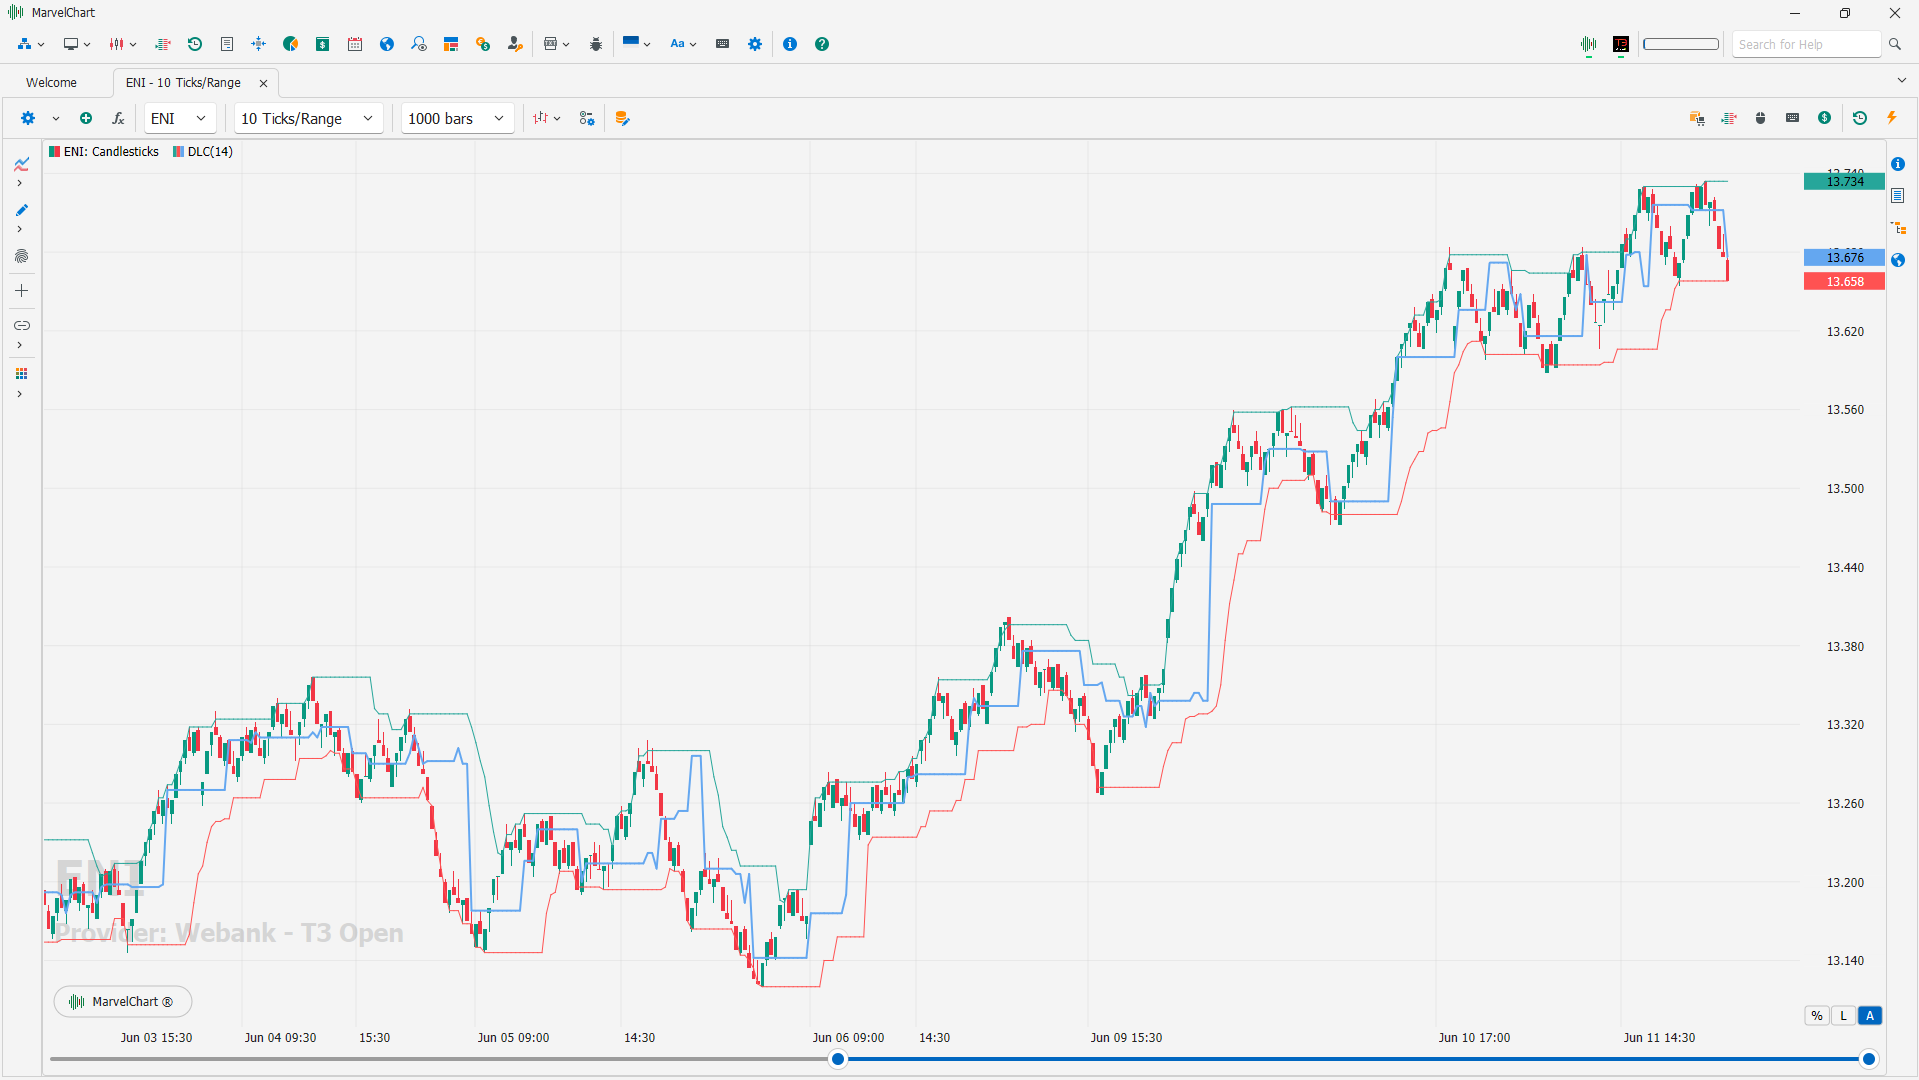
The indicator dynamically determines and shows the values of the POC level and the channel formed by the VAH and VAL levels. Based on price changes relative to these levels, signals of increasing selling or buying pressure are generated.
Footprint
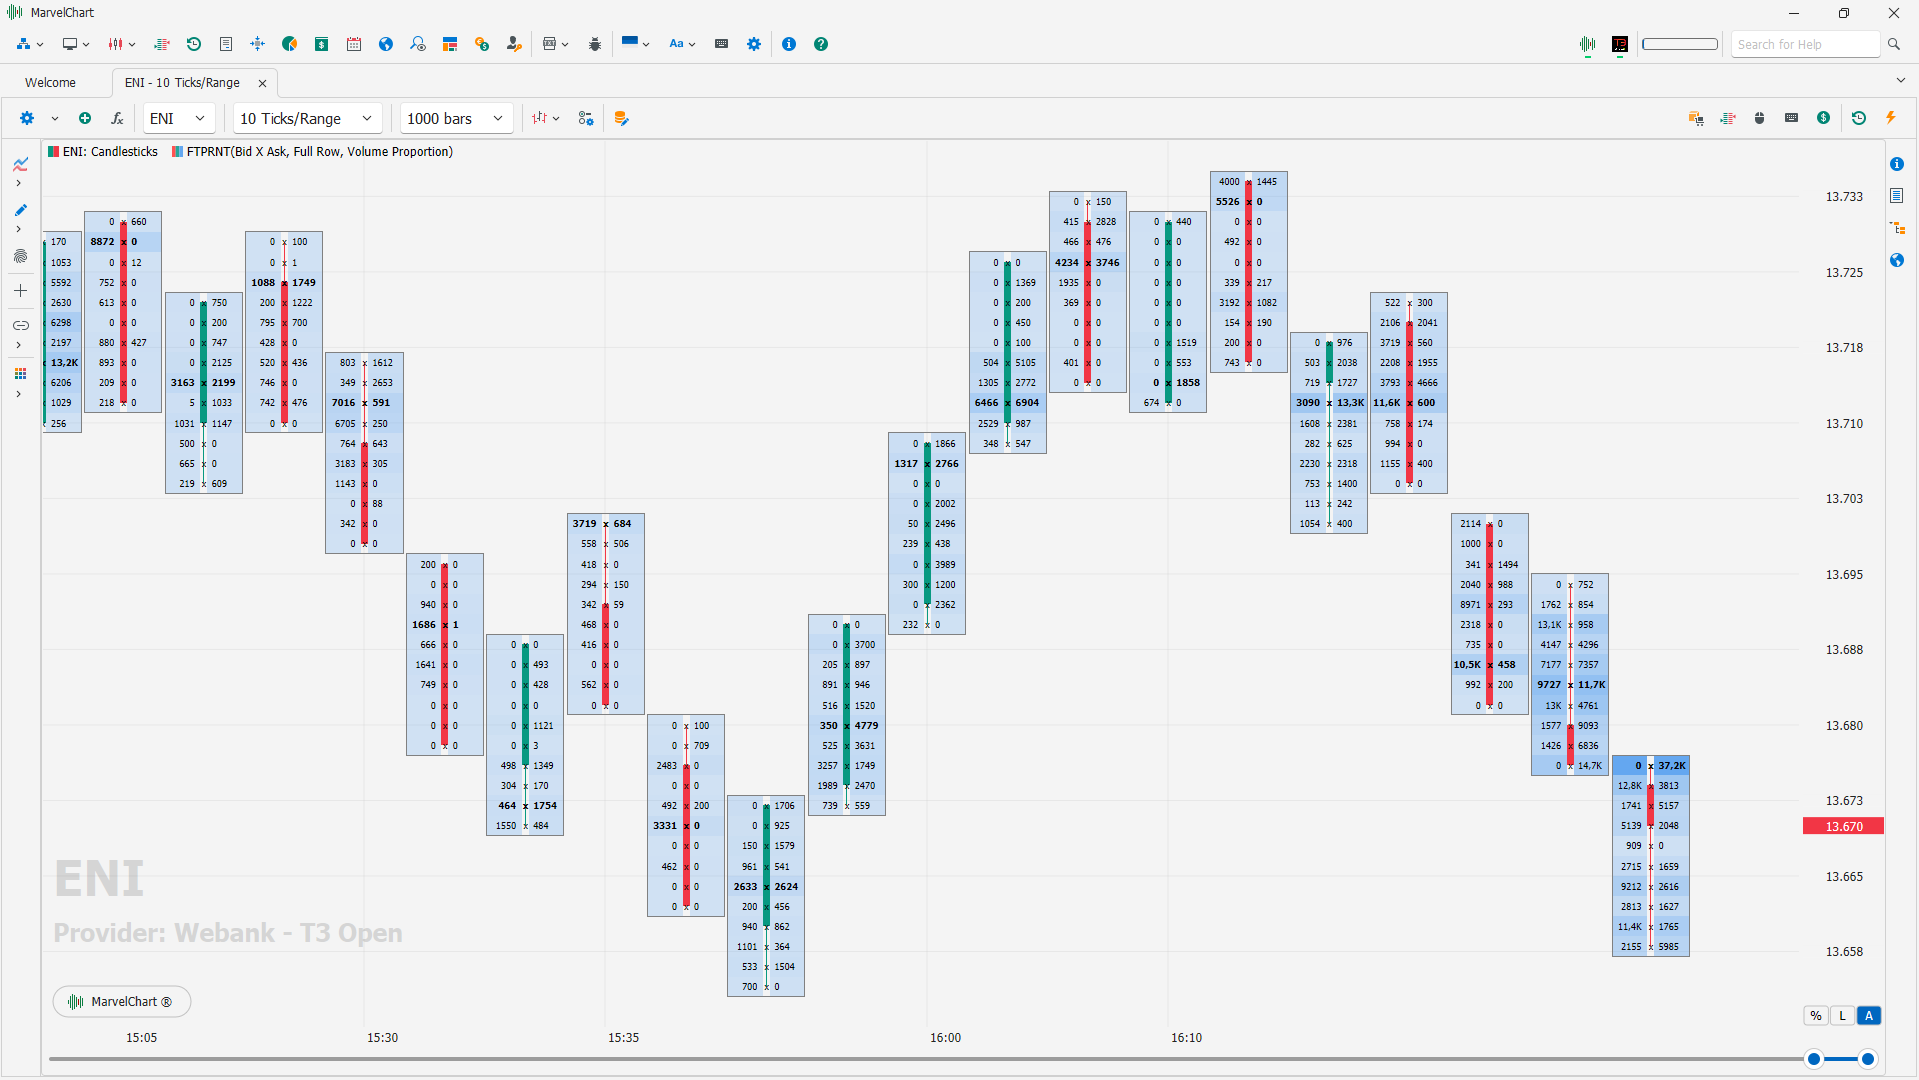
Volume cluster analysis in trading uses volume data to identify patterns and potential price movements. It groups trades with the same price into ""clusters"" to reveal the dominance of buying or selling at various price levels. These clusters, often displayed on a chart, help traders assess market sentiment and identify support/resistance zones.
Key Concepts
Cluster
A group of trades at the same price level, representing the total volume of buy and sell orders executed at that price.
Price Level
The price at which trades are clustered.
Volume
The total quantity of shares or contracts traded at a specific price level.
Aggressive Buy/Sell
Trades that significantly impact price movement and are often identified by high volume and color-coded (e.g., green for aggressive buys, red for aggressive sells) on the cluster chart.
Delta
The difference between the total volume of buy orders and sell orders at a particular price level, indicating whether buyers or sellers are dominant.
Benefits of Volume Cluster Analysis
Identifying Market Sentiment
Clusters can reveal whether buyers or sellers are more active at specific price levels, helping traders assess market sentiment.
Identifying Support/Resistance Zones
High volume clusters can act as support or resistance levels, suggesting where price might find difficulty in moving beyond.
Understanding Accumulation/Distribution
Cluster analysis can help identify stages of accumulation (major players buying) and distribution (major players selling), which are crucial in Volume Spread Analysis (VSA).
Predicting Price Movements
High volume clusters, especially during price breakouts, can indicate potential price swings and help traders anticipate future movements.
How it Works
Data Collection
Volume data is gathered from various sources, including tick data, which provides detailed information on each trade.
Grouping Trades
Trades with the same price are grouped together, forming clusters.
Visual Representation
The clusters are displayed on a chart, often with color coding to indicate the dominance of buy or sell orders and the aggressiveness of trades.
Analysis
Traders analyze the clusters to identify patterns, assess market sentiment, and make informed trading decisions.
Examples
A large, green cluster on a cluster chart during an uptrend suggests strong buying pressure at that price level, potentially acting as support.
A large, red cluster during a downtrend indicates strong selling pressure, potentially acting as resistance.
Clusters forming near support or resistance levels can help traders identify potential entry points or stop-loss levels.
Settings
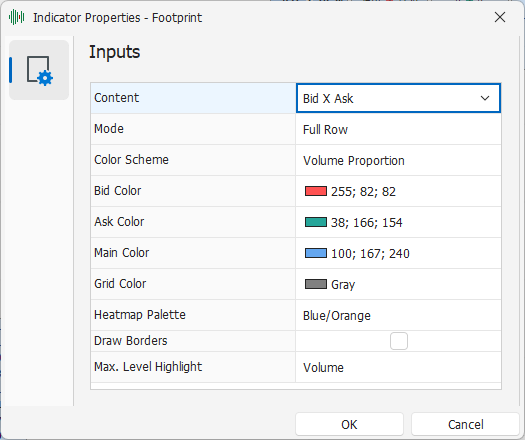
Content - Select the texts to display within the clusters. The available choices are:
None: Does not display any textual numerical data in the clusters;
Volume: Shows the volume of transactions executed within a given cluster;
Trades: Shows the number of transactions executed within a given cluster;
Volume and Trades: Shows the volume (on the left) and the number of transactions executed (on the right) within a given cluster;
Volume and Delta: Shows the volume (on the left) and the difference between the buy and sell volume (on the right) within a given cluster;
Delta: Shows the difference between the buy and sell volume within a given cluster;
Delta (centered): Shows the difference between the buy and sell volumes within a given cluster. If positive, it is drawn on the right side, if negative, it is drawn on the left side;
Bid X Ask: Shows the buy and sell volumes within a given cluster, centered on the candlestick;
Bid and Ask: Shows the buy and sell volumes within a given cluster.
Mode: Select the type of cluster to display. The available choices are:
Full Row: The entire row is used for rendering;
Bid/Ask Profile: Draws a horizontal bar chart, representing the distribution of buy (right) and sell (left) volumes across different price levels;
Volume Profile: Draws a horizontal bar chart, representing the distribution of total volumes across different price levels;
Transaction Profile: Draws a horizontal bar chart, representing the distribution of the number of total transactions performed across different price levels;
Delta Profile: Draws a horizontal histogram chart, representing the distribution of the difference between the purchase and sale volumes, in absolute value;
Bid/Ask Ladder: Draws a horizontal histogram chart, representing the distribution of the purchase (on the right) and sale (on the left) volumes on the different price levels. Only the side with the highest volumes is drawn;
Positive/Negative Delta Proportion: Draws a horizontal histogram chart, representing the distribution of the difference between the purchase and sale volumes. If positive, the histogram is drawn on the right side of the candle, if negative, it is drawn on the left side of the candle;
Color Scheme - Select the scheme to use to color the clusters. The available choices are:
None: The areas determined by the Mode parameter are not colored;
Delta: Uses the difference between the purchase and sale volumes to determine the color to use to color the clusters;
Solid: Uses a uniform color to color the clusters;
Volume Proportion: Uses a progressive color gradient to color clusters, with higher intensity at higher volumes;
Transaction Proportion: Uses a progressive color gradient to color clusters, with higher intensity at higher numbers of executed transactions;
Bid/Ask Volume Proportion: Uses two progressive color gradients to color clusters, one based on buy volumes and one based on sell volumes, with higher intensity at higher volumes;
Heatmap By Volume: Uses a Heatmap to color clusters, using total volume to measure the intensity of the Heatmap;
Heatmap By Trades: Uses a Heatmap to color clusters, using the number of total executed trades to measure the intensity of the Heatmap;
Heatmap By Delta: Uses a Heatmap to color clusters, using the difference between buy and sell volumes to determine the intensity of the Heatmap;
Bid Color - Color for buy clusters;
Ask Color - Color for sell clusters;
Main Color - General color;
Grid Color - Grid color;
Heatmap Palette - If Color Scheme is set to one of the values that allow drawing via Heatmap, it allows you to choose which shades and tones to use to color the clusters;
Draw Borders - If active, the borders of all the clusters are drawn inside the candles;
Maximum. Level Highlight - Selection of the measure with which to determine which price level to highlight inside each single candle of the chart. The available choices are:
None: No price level will be highlighted;
Volume: The price level with the greatest total volume within the candle will be highlighted;
Trades: The price level with the highest number of transactions within the candle will be highlighted;
Bids: The price level with the highest selling volume within the candle will be highlighted;
Ask: The price level with the highest buying volume within the candle will be highlighted;
Negative Delta: The price level with the most negative Delta within the candle will be highlighted;
Positive Delta: The price level with the most positive Delta within the candle will be highlighted;
Imbalance
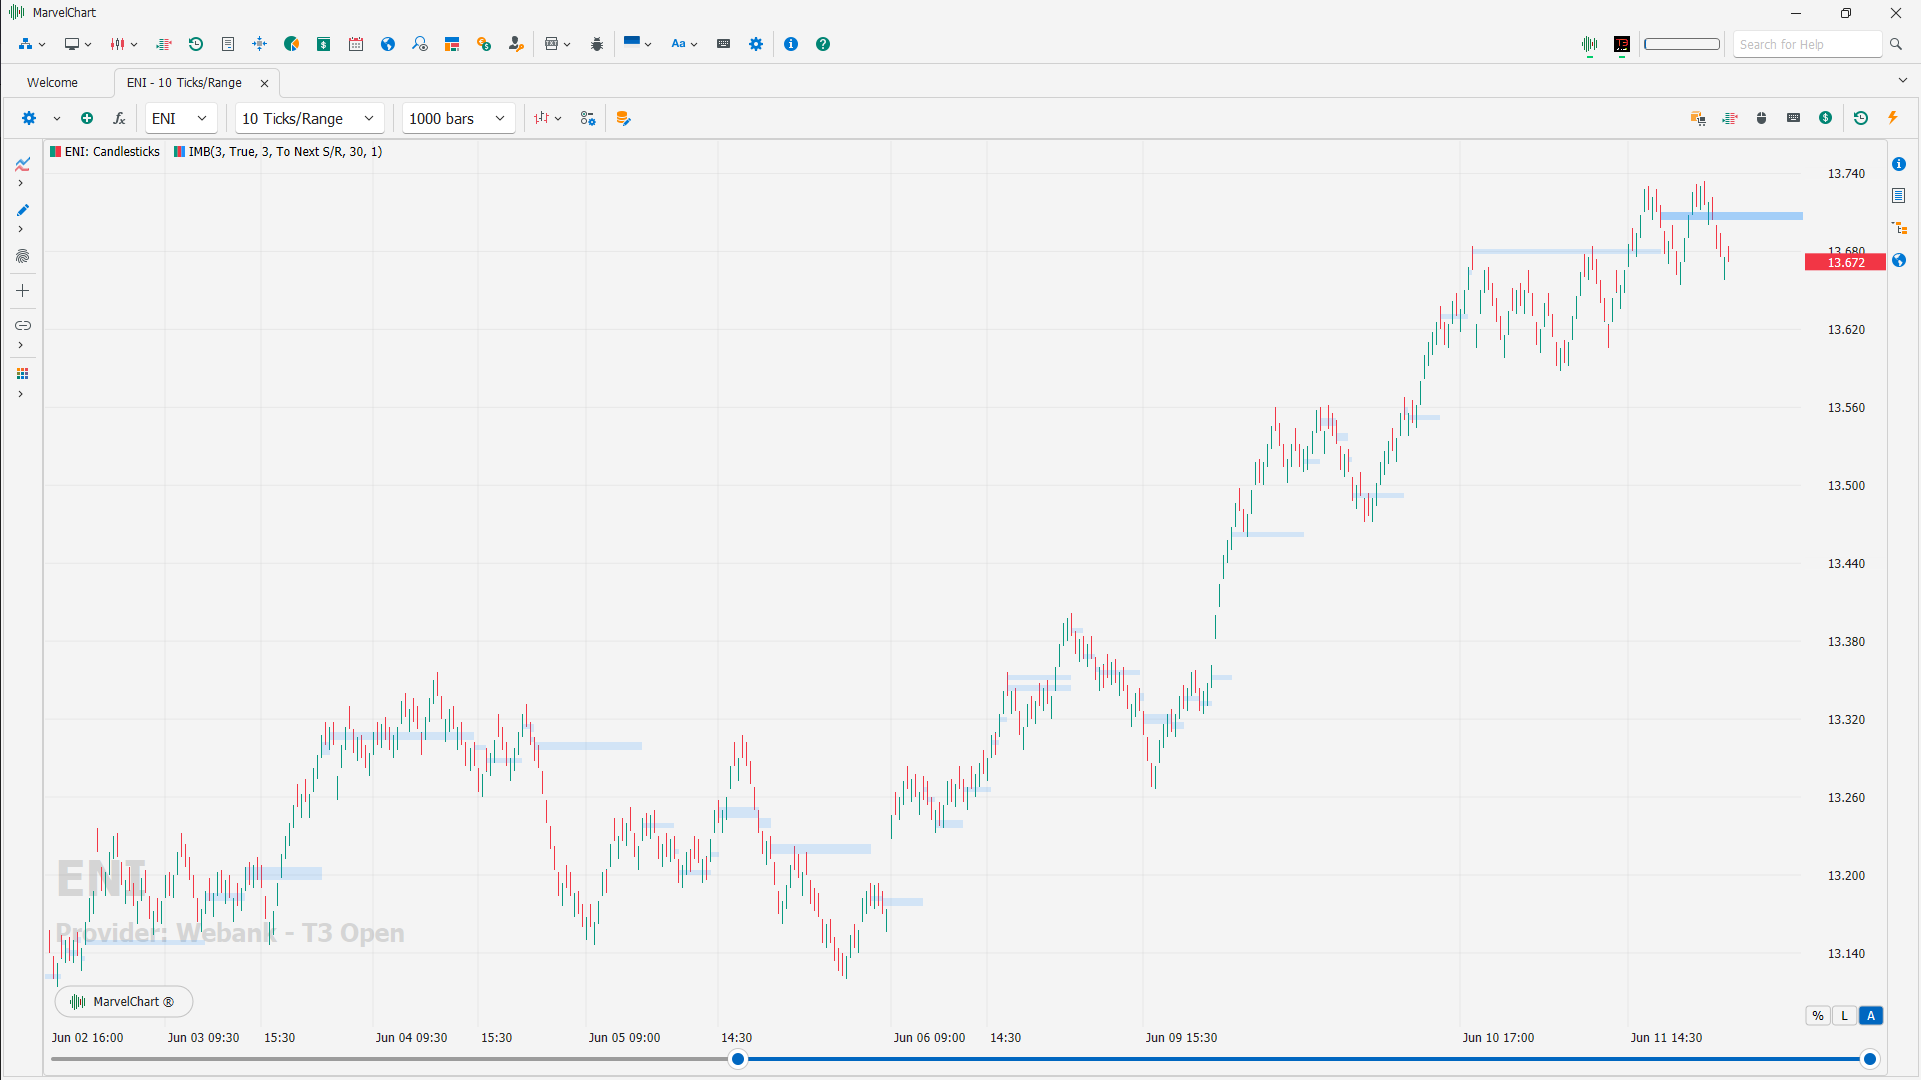
In volume analysis an Imbalance occurs when there is a significant difference between buy and sell orders sizes. The Imbalance indicator is a tool for identifying imbalances in the volume of candles on the chart. The algorithm shows the volume traded by bid and ask at each price level for each bar on the chart, compares bid and ask diagonally (in both directions) and highlights significant excess of one over the other. Understanding these imbalances can help traders make more informed decisions about when to enter or exit positions.
Let's see how the trader can manage this phenomenon that is often perceived as a good new trading opportunity, so here's how it is calculated.
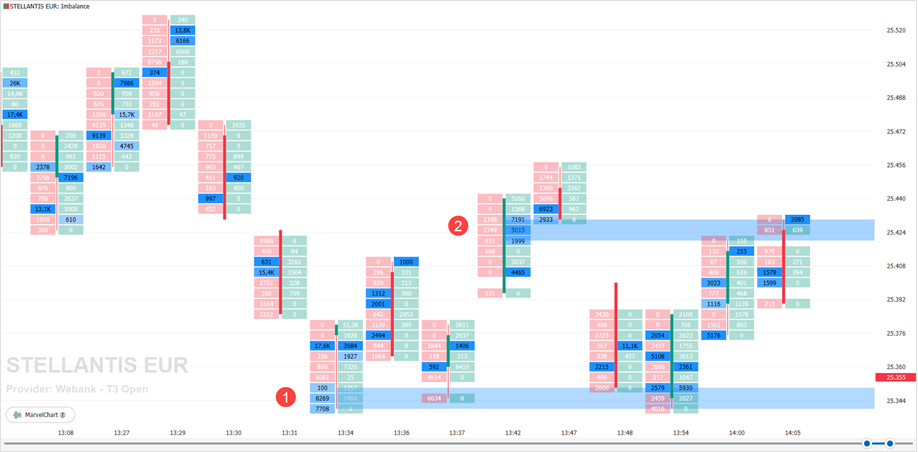
In the image above you can see how after three Imbalances in the same bar the light blue Support line 1 has been drawn. In fact the price takes the path of the climb. Then, in the bar relative to the point 2 another three Imbalances have occurred thus drawing a Resistance.
Settings
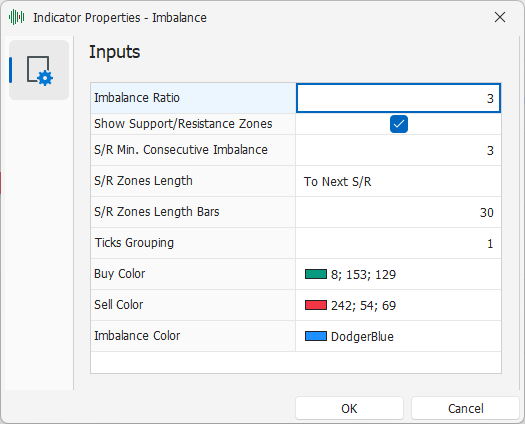
Imbalance Ratio: the percentage you want to intercept by comparing the Bid and Ask volumes in two different adjacent price levels;
Show Support/Resistance Zones: activate to display support and resistance zones;
S/R Min. Consecutive Imbalance: how many adjacent Imbalances must there be before drawing a support or resistance;
S/R Zones Length: allows you to choose how to display the support/resistance line in one of three modes:
To Chart End: the S/R line will be drawn up to the right edge of the chart, and will always be present even if new S/R lines are generated;
To Next S/R: this choice allows you to display the S/R line only until a new S/R line is generated;
Fixed number of Bars: each S/R line has the same length, which can be changed by setting the value in the “S/R Length in Bars” field;
S/R Zones Length Bars: when S/R Zones Lenght is set to Fixed number of Bars, this field allows you to choose the length of the S/R line in bars;
Ticks Grouping: the number of ticks that make up a price level in the candles;
Buy Color: the color of the column with the volumes traded on Ask;
Sell Color: the color of the column with the volumes traded on Bid;
Imbalance Color: color to highlight Imbalance conditions and draw support and resistance zones.
Order Flow
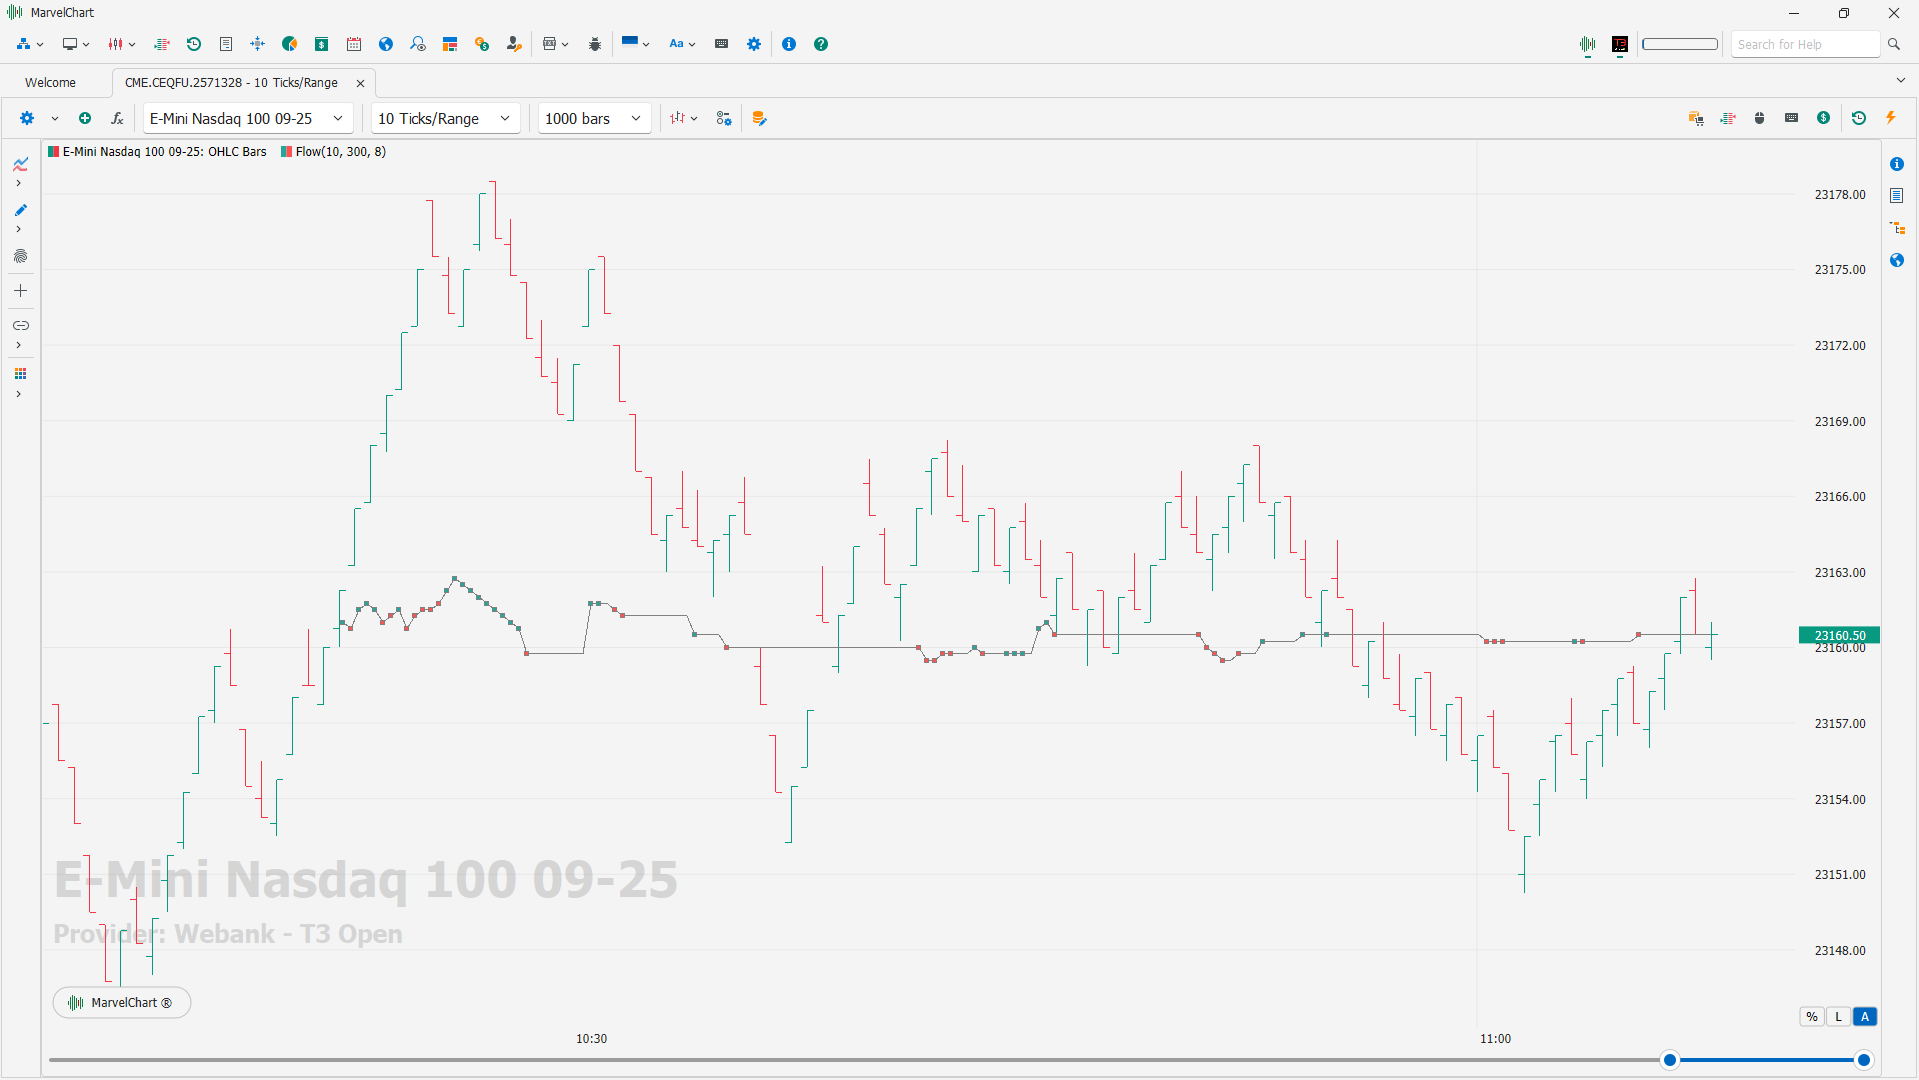
This indicator displays order flow directly on the chart in real time.
Trades Track
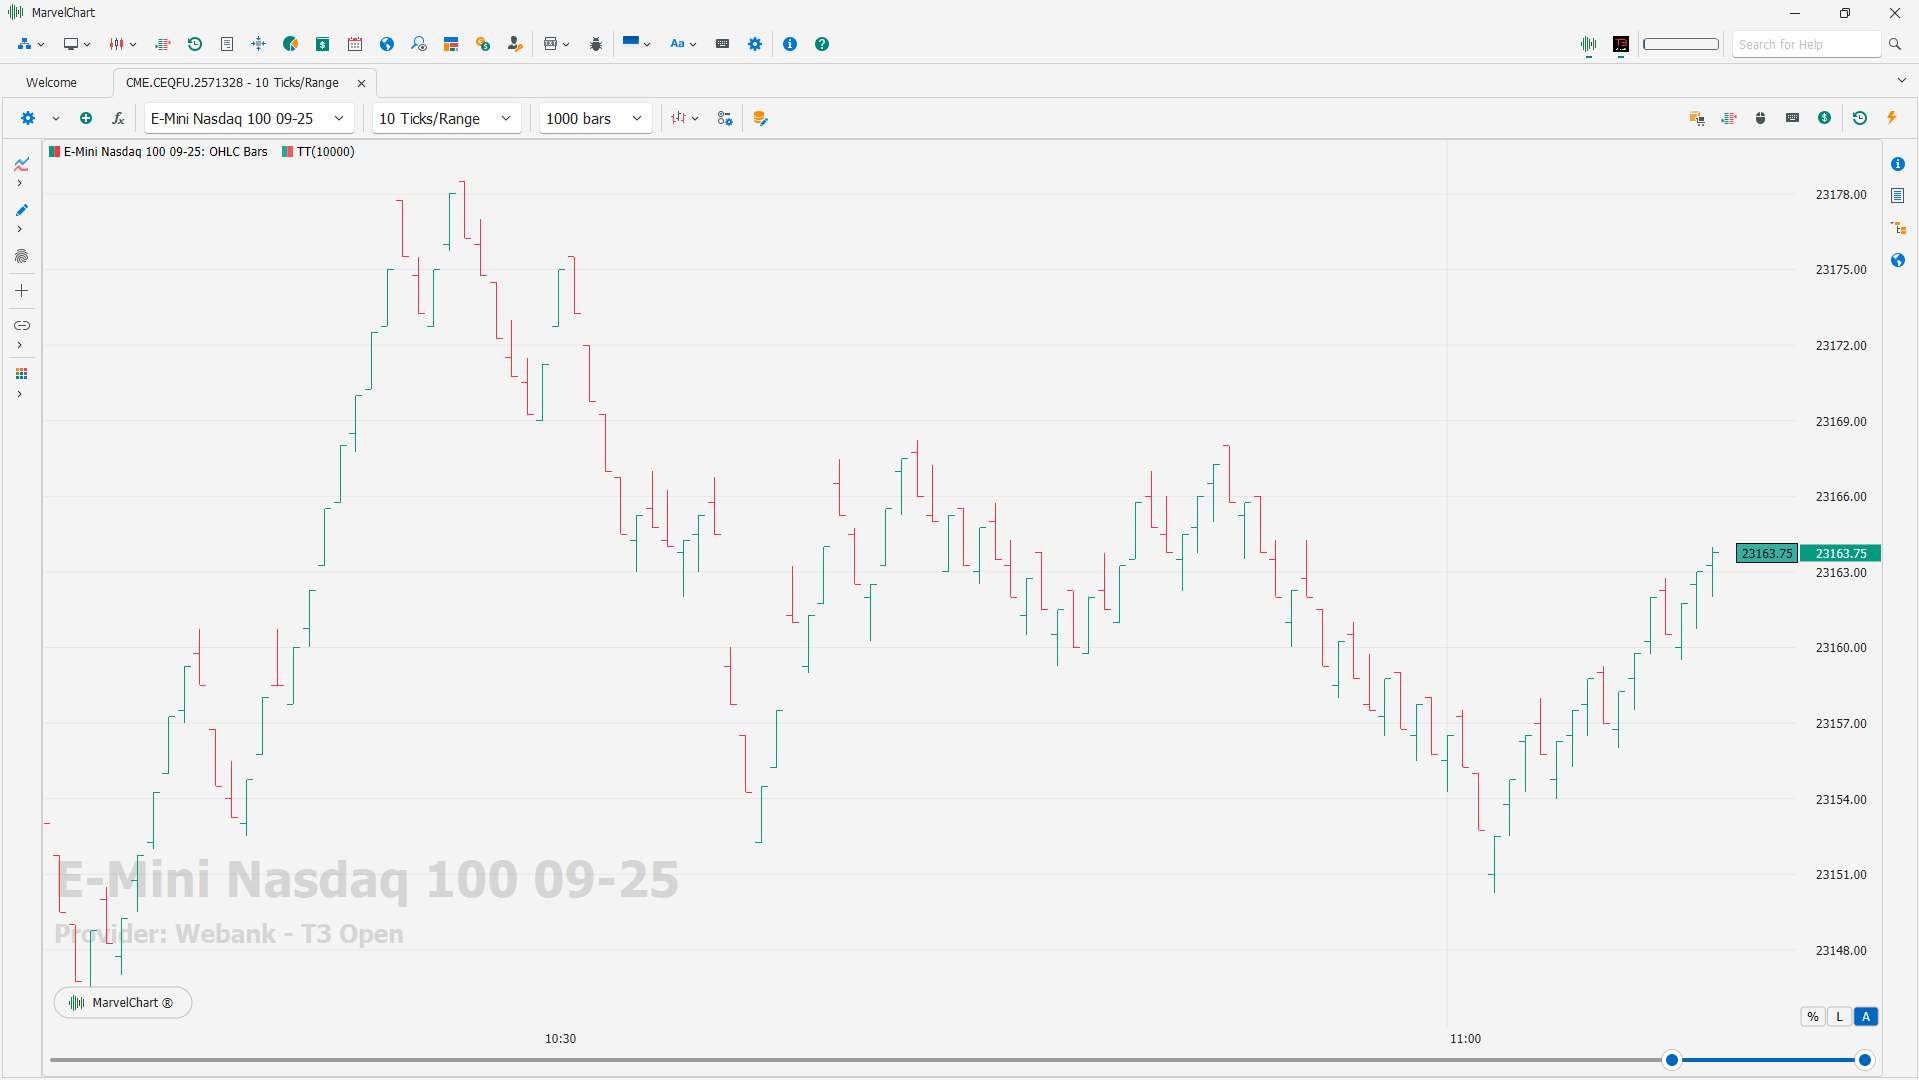
The indicator displays buys and sells in real time in the form of appearing and fading marks at the current price level.
Volume Profile
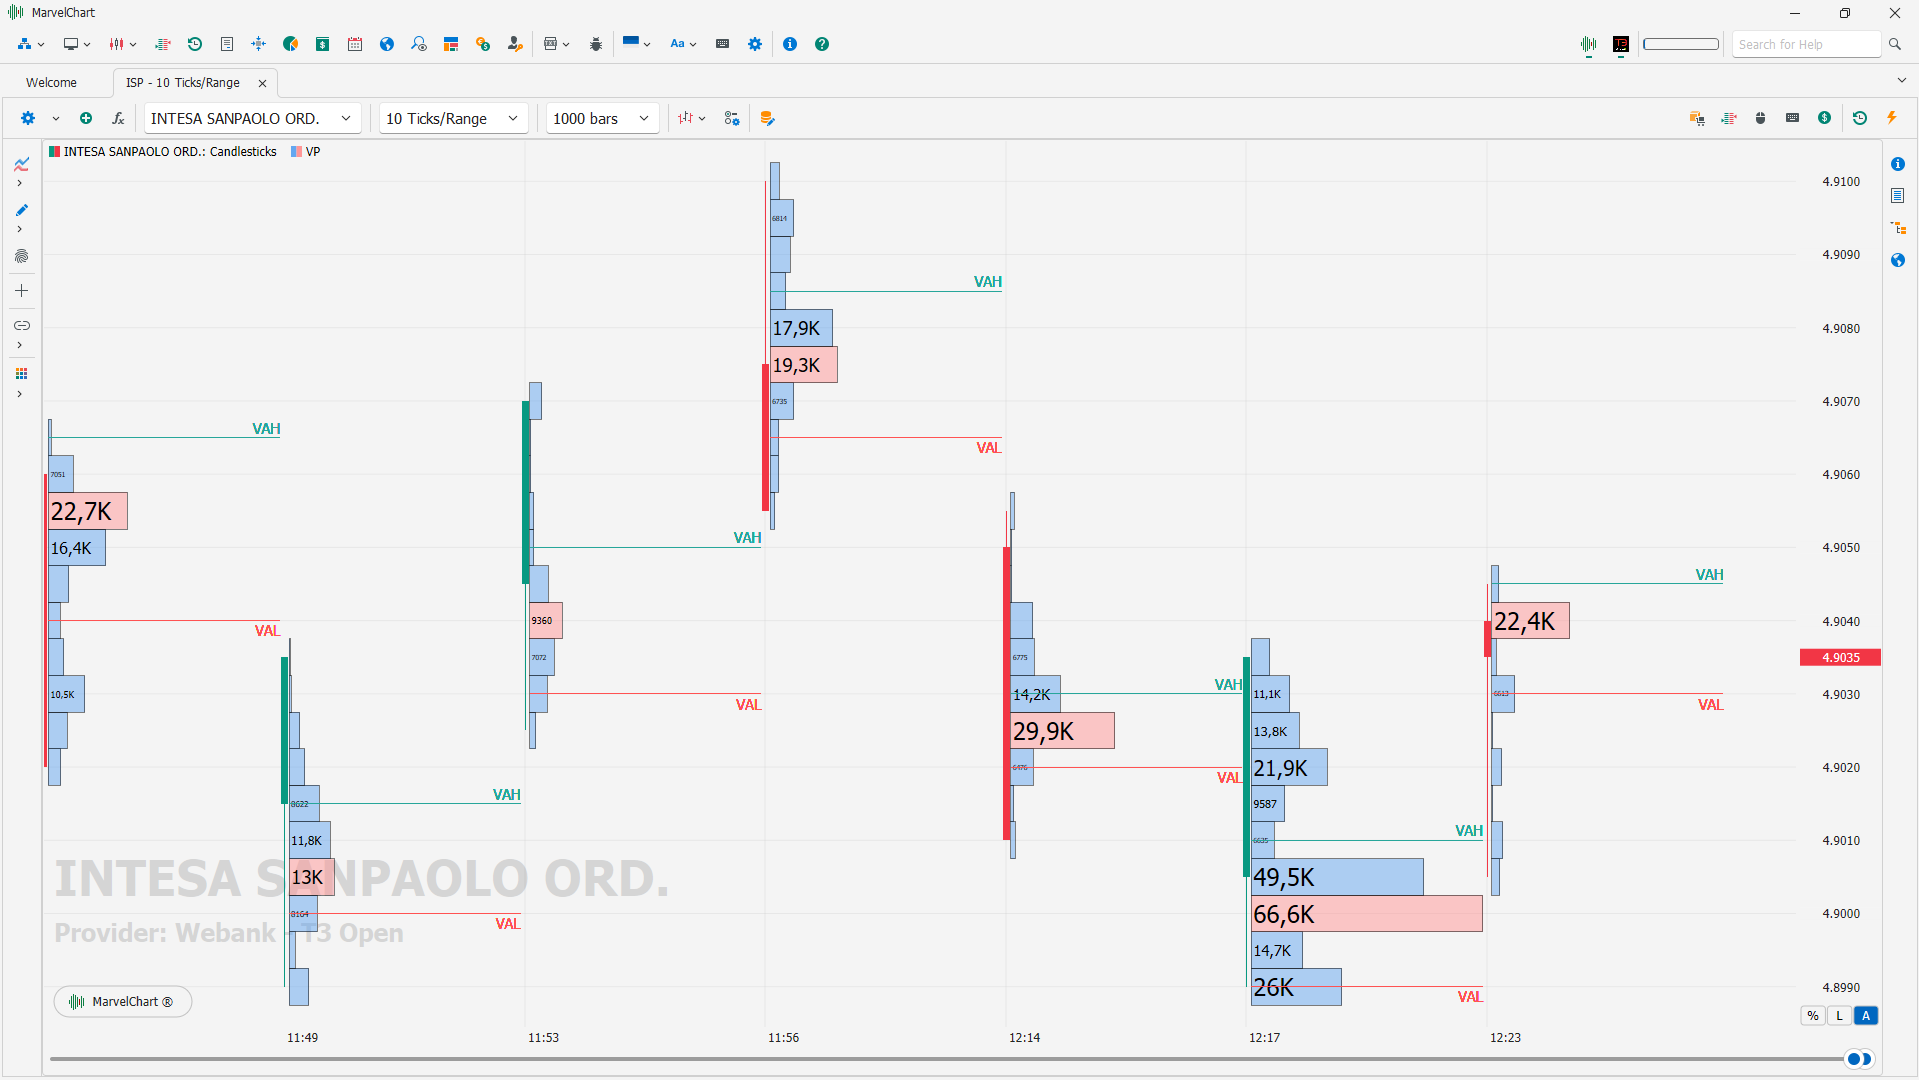
The Volume Profile indicator is a technical analysis tool that visualizes the distribution of trading volume at different price levels, helping traders identify areas of support and resistance, as well as points of maximum and minimum volume.
What it is and how it works
The Volume Profile creates a histogram that shows the trading volume at each price level;
The higher the volume at a given price level, the greater the height of the histogram.
In practice, the Volume Profile helps you understand where the majority of trading has taken place and therefore where areas of support and resistance are most likely to occur.
Main uses
Identifying support and resistance: Areas of higher volume can represent potential areas of support and resistance. If the price approaches an area of high volume, it is more likely to be rejected (resistance) or supported (support);
Identifying POC (Point of Control): The POC is the price level with the highest volume. The POC can indicate an area of market equilibrium, where the price may have more difficulty breaking through;
Volume Analysis: The indicator helps you understand volume dynamics and assess whether price movements are supported by significant volume;
Anchored Volume Profile: Allows you to analyze volume over a specific period of time, rather than the entire price movement.
Disadvantages
Not always an accurate signal: The indicator does not guarantee 100% that an area of high volume will be a definitive support or resistance;
Requires knowledge of the context: The Volume Profile must be interpreted in combination with other indicators and the market context to achieve better results.
