Volume
Bid/Ask Volume Difference
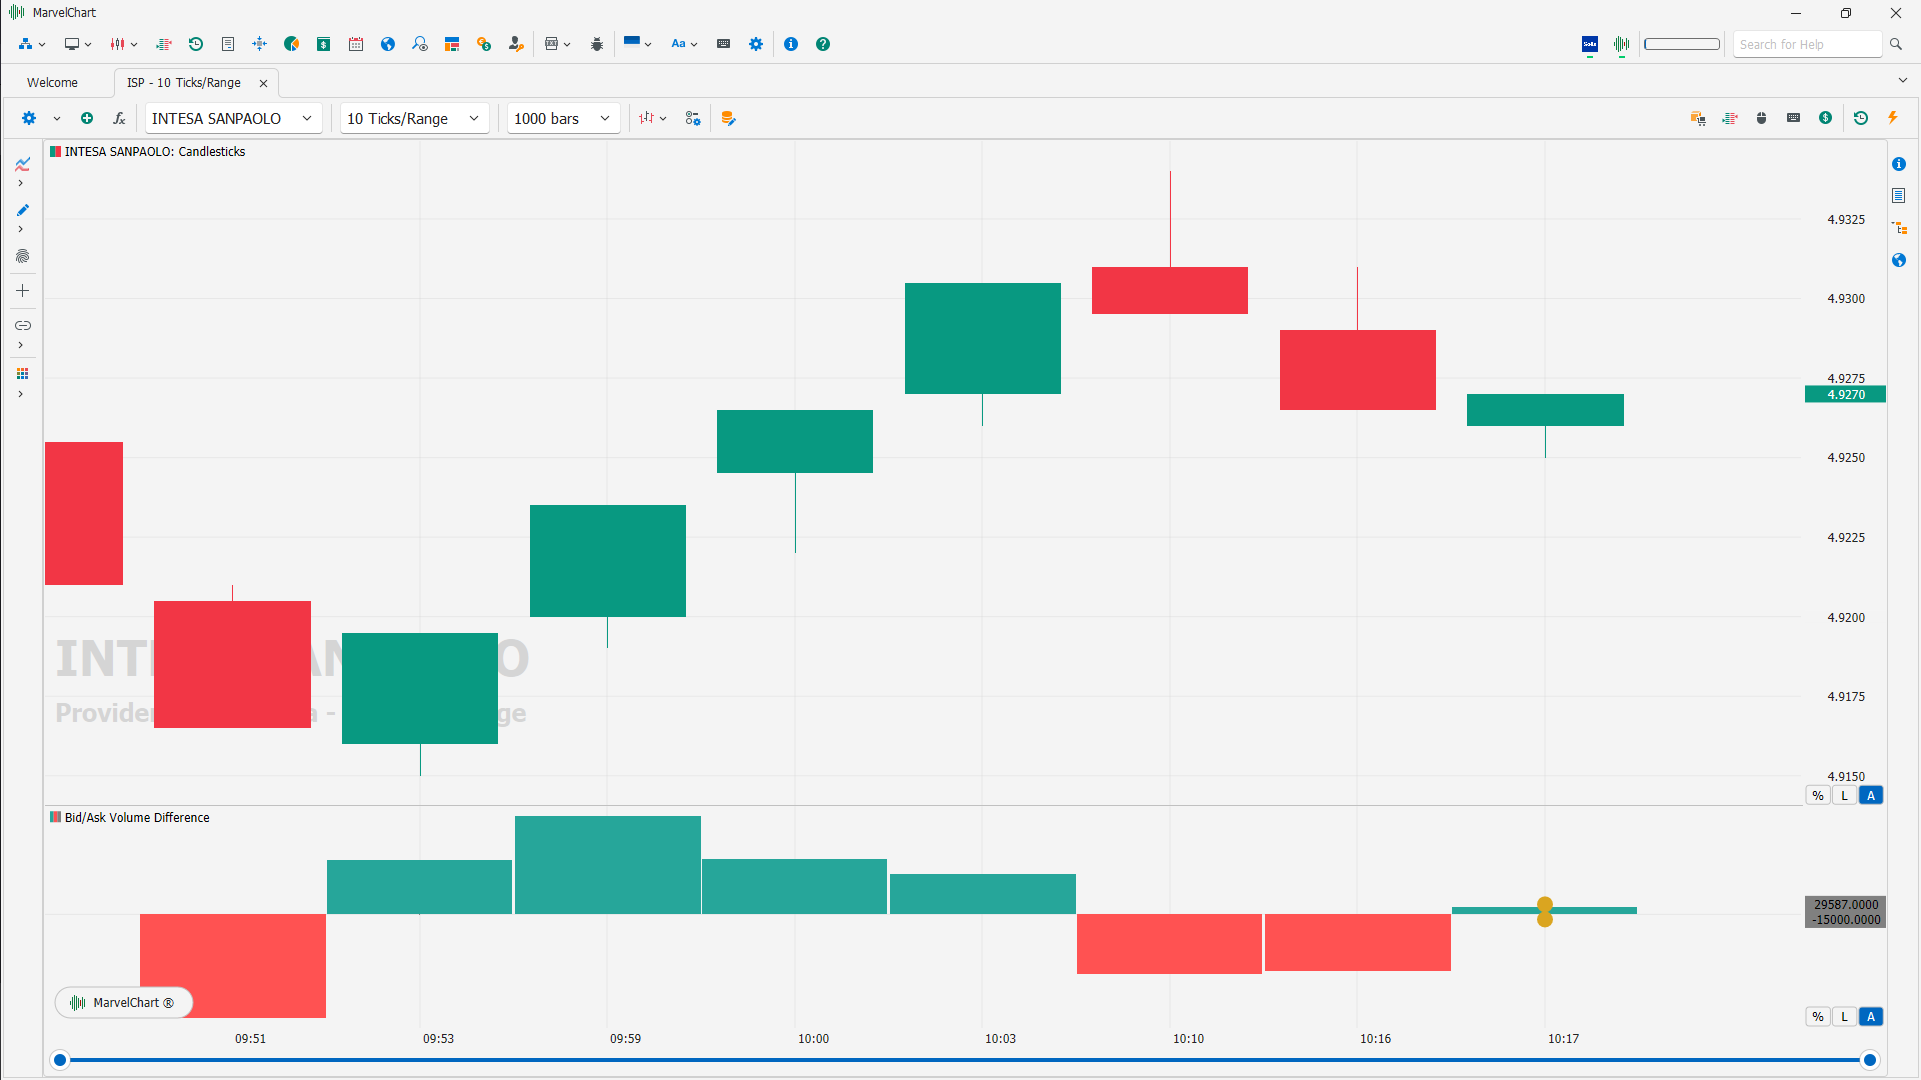
The Ask/Bid Volume Difference Bars is a candlestick indicator that shows the dynamics of the selling and buying volume difference during one bar. The candlestick High is the maximum Delta during a bar, while the Low is the minimum Delta, and Close is the actual Delta.
Cumulative Volume Delta
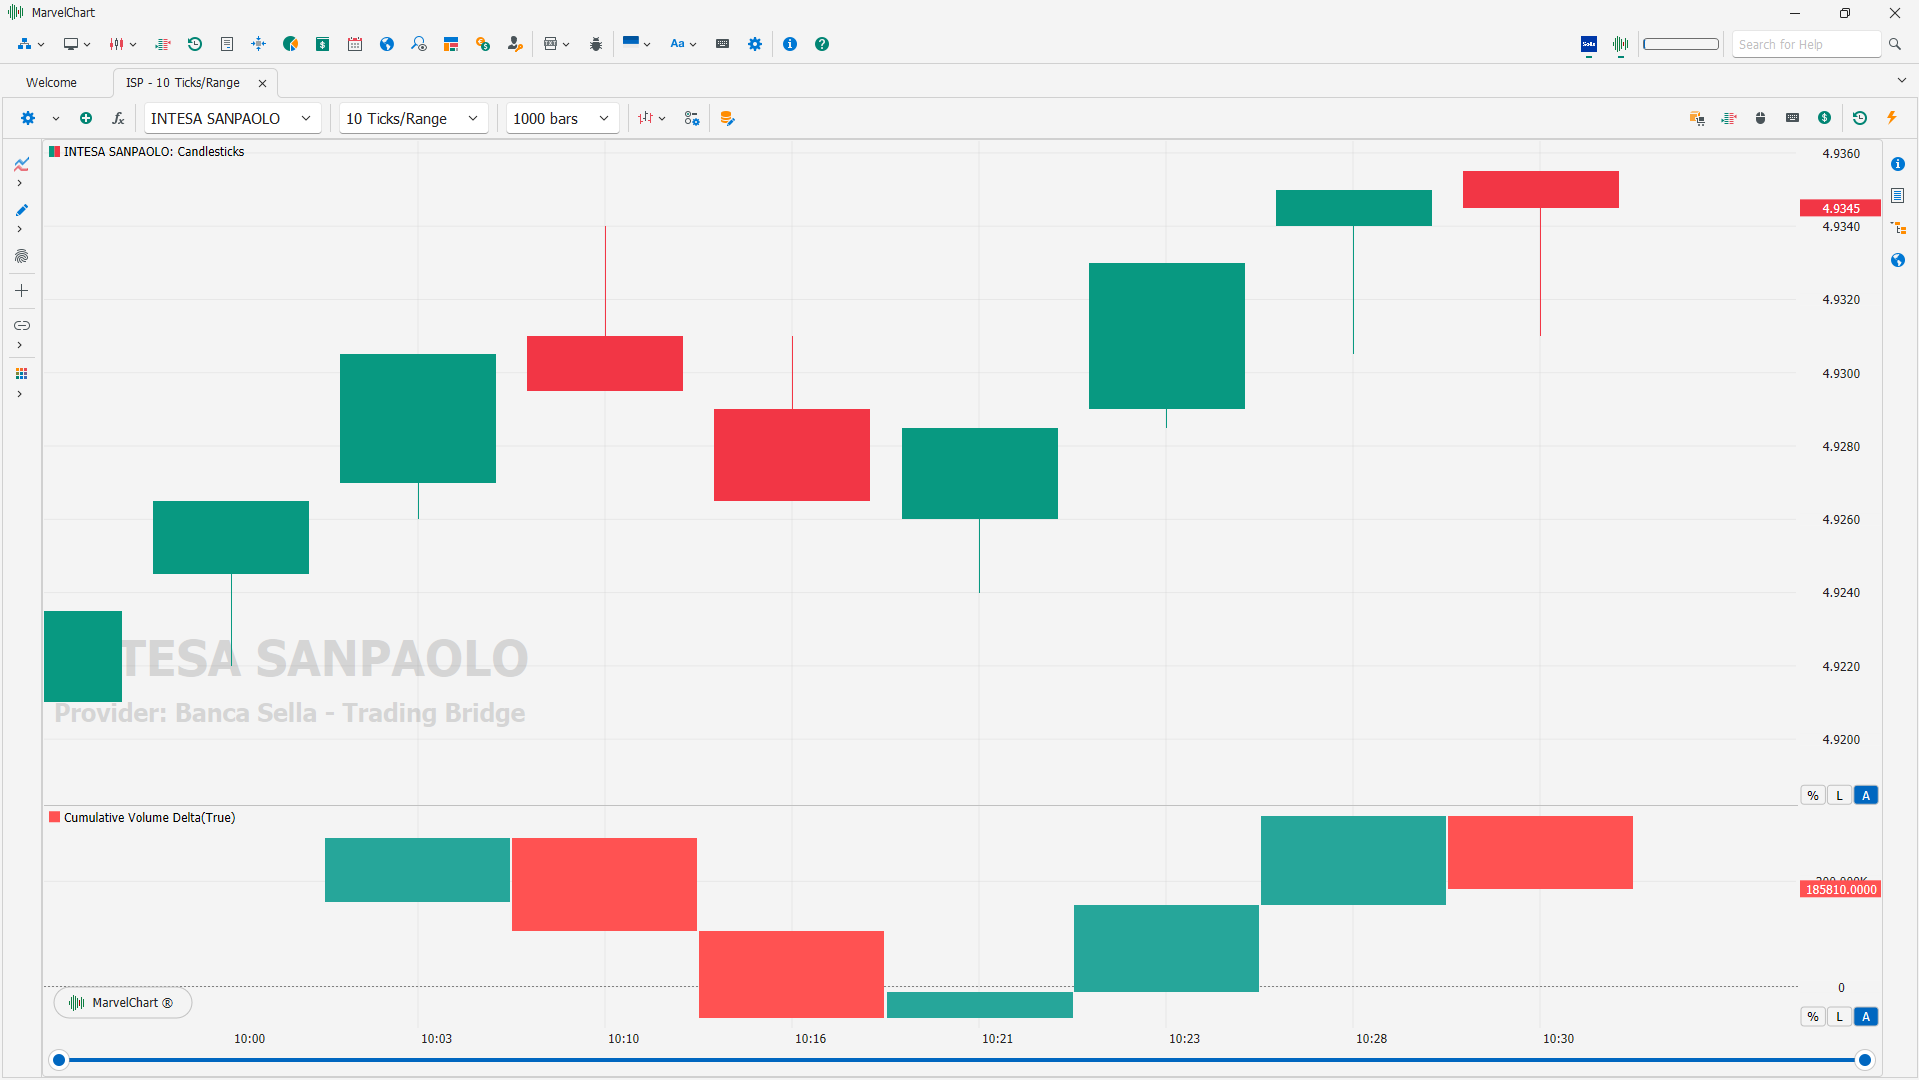
Cumulative Volume Delta (CVD) is a technical analysis tool that tracks the difference between buying and selling volume. It's used to assess market trends and predict price movements.
How it works
CVD adds the delta values of each price bar;
It plots the value underneath the price chart;
A positive delta value indicates buying pressure is greater than selling pressure;
A negative delta value indicates selling pressure is greater than buying pressure.
How to use it
Compare CVD with price action and market structure;
Use CVD to understand market sentiment.
Benefits
CVD provides a comprehensive view of buying and selling pressure;
CVD helps traders assess market trends;
CVD helps traders predict asset price directions.
Delta
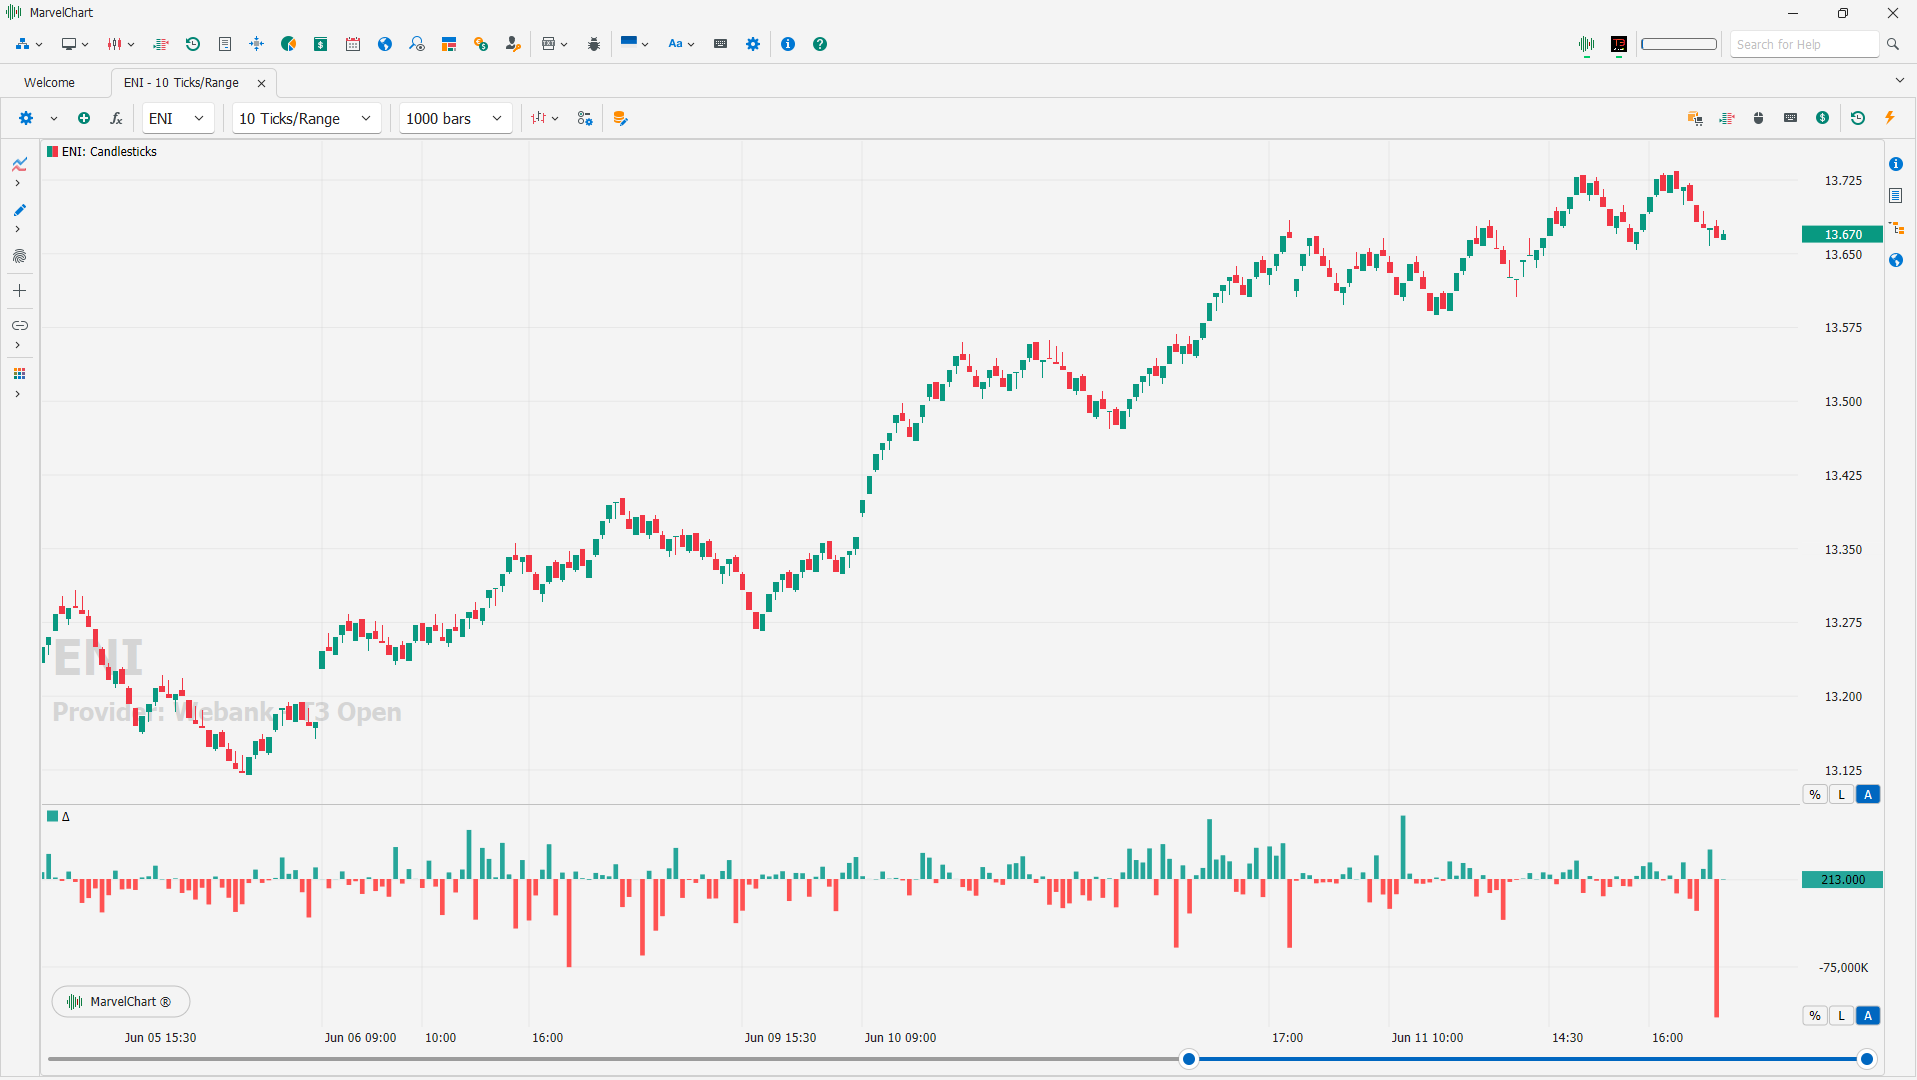
The Delta indicator shows the difference between volumes of buy and sell trades. A positive Delta value indicates buying pressure is greater than selling pressure. A negative Delta value indicates selling pressure is greater than buying pressure.
Order Flow Rhythm
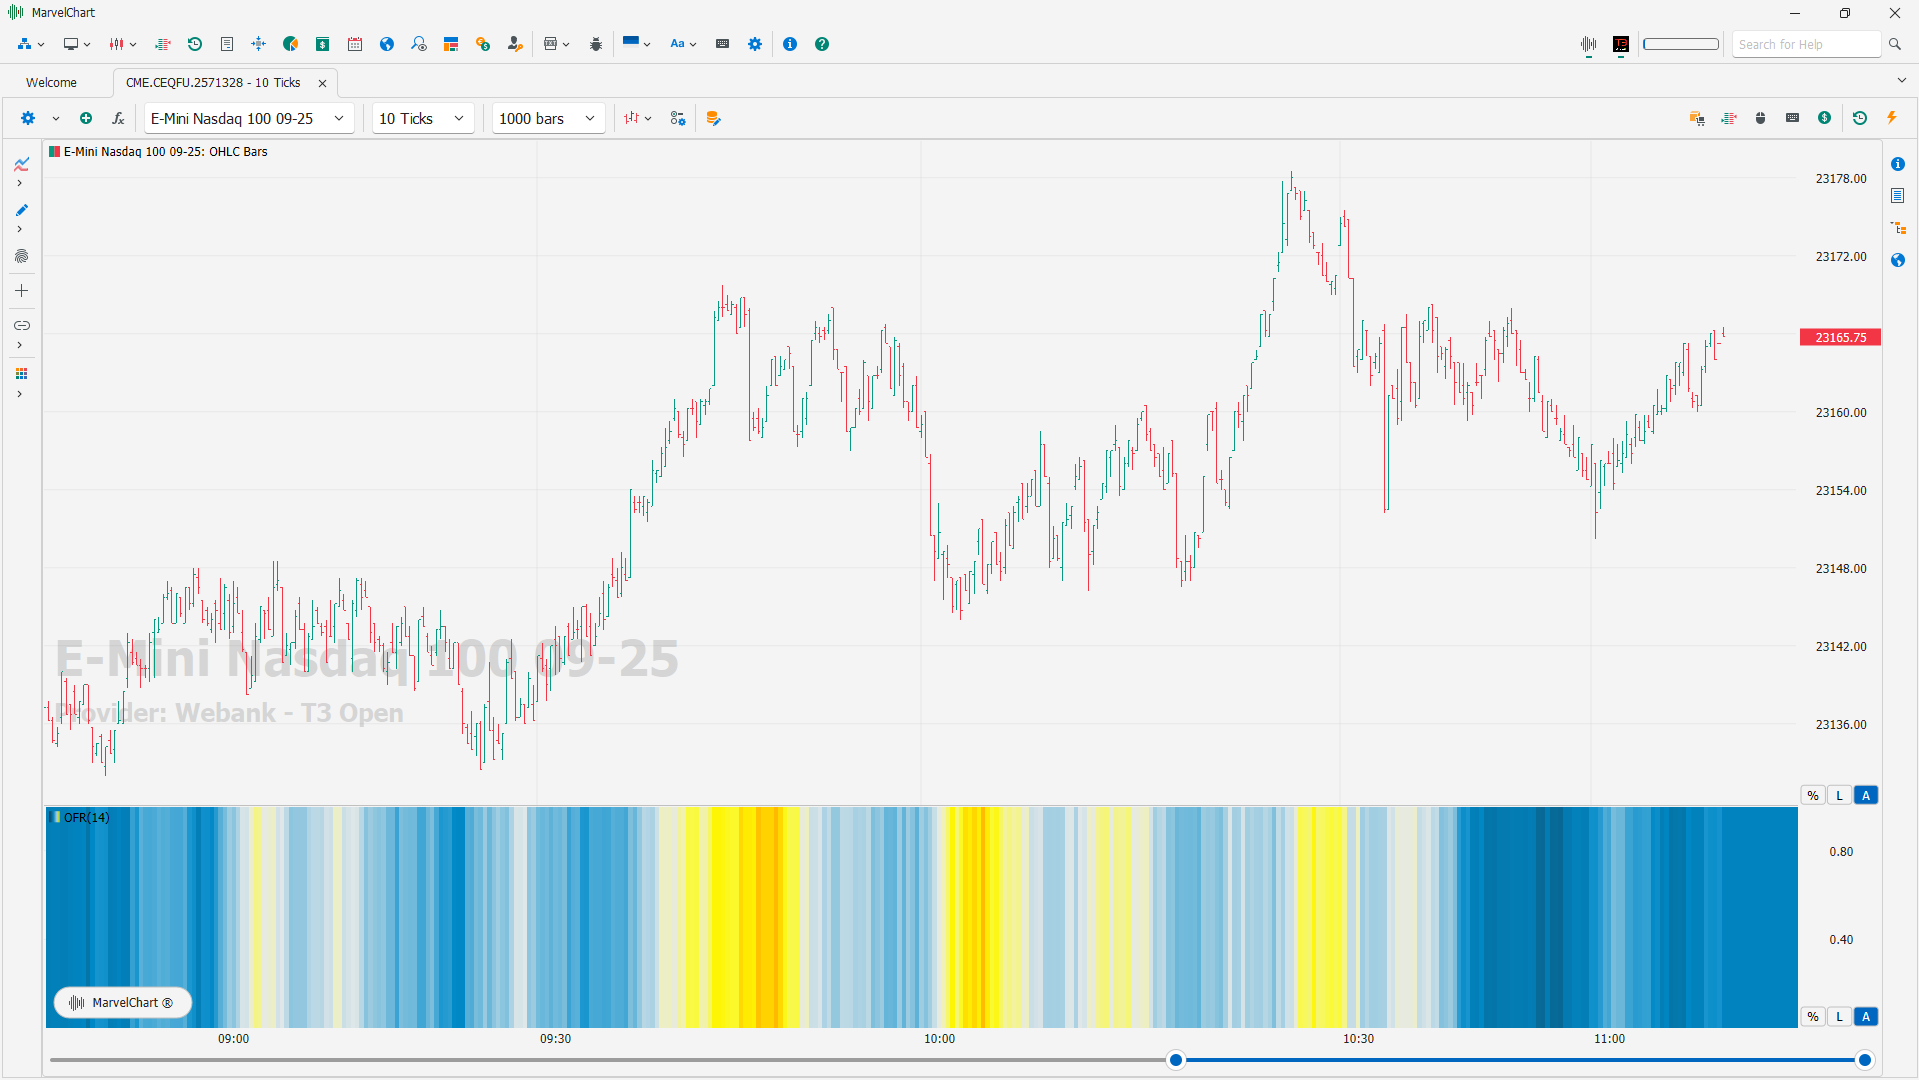
The Order Flow Rhythm indicator visualizes the speed of deal flow in the form of a heat map.
Volume Delta Text Box
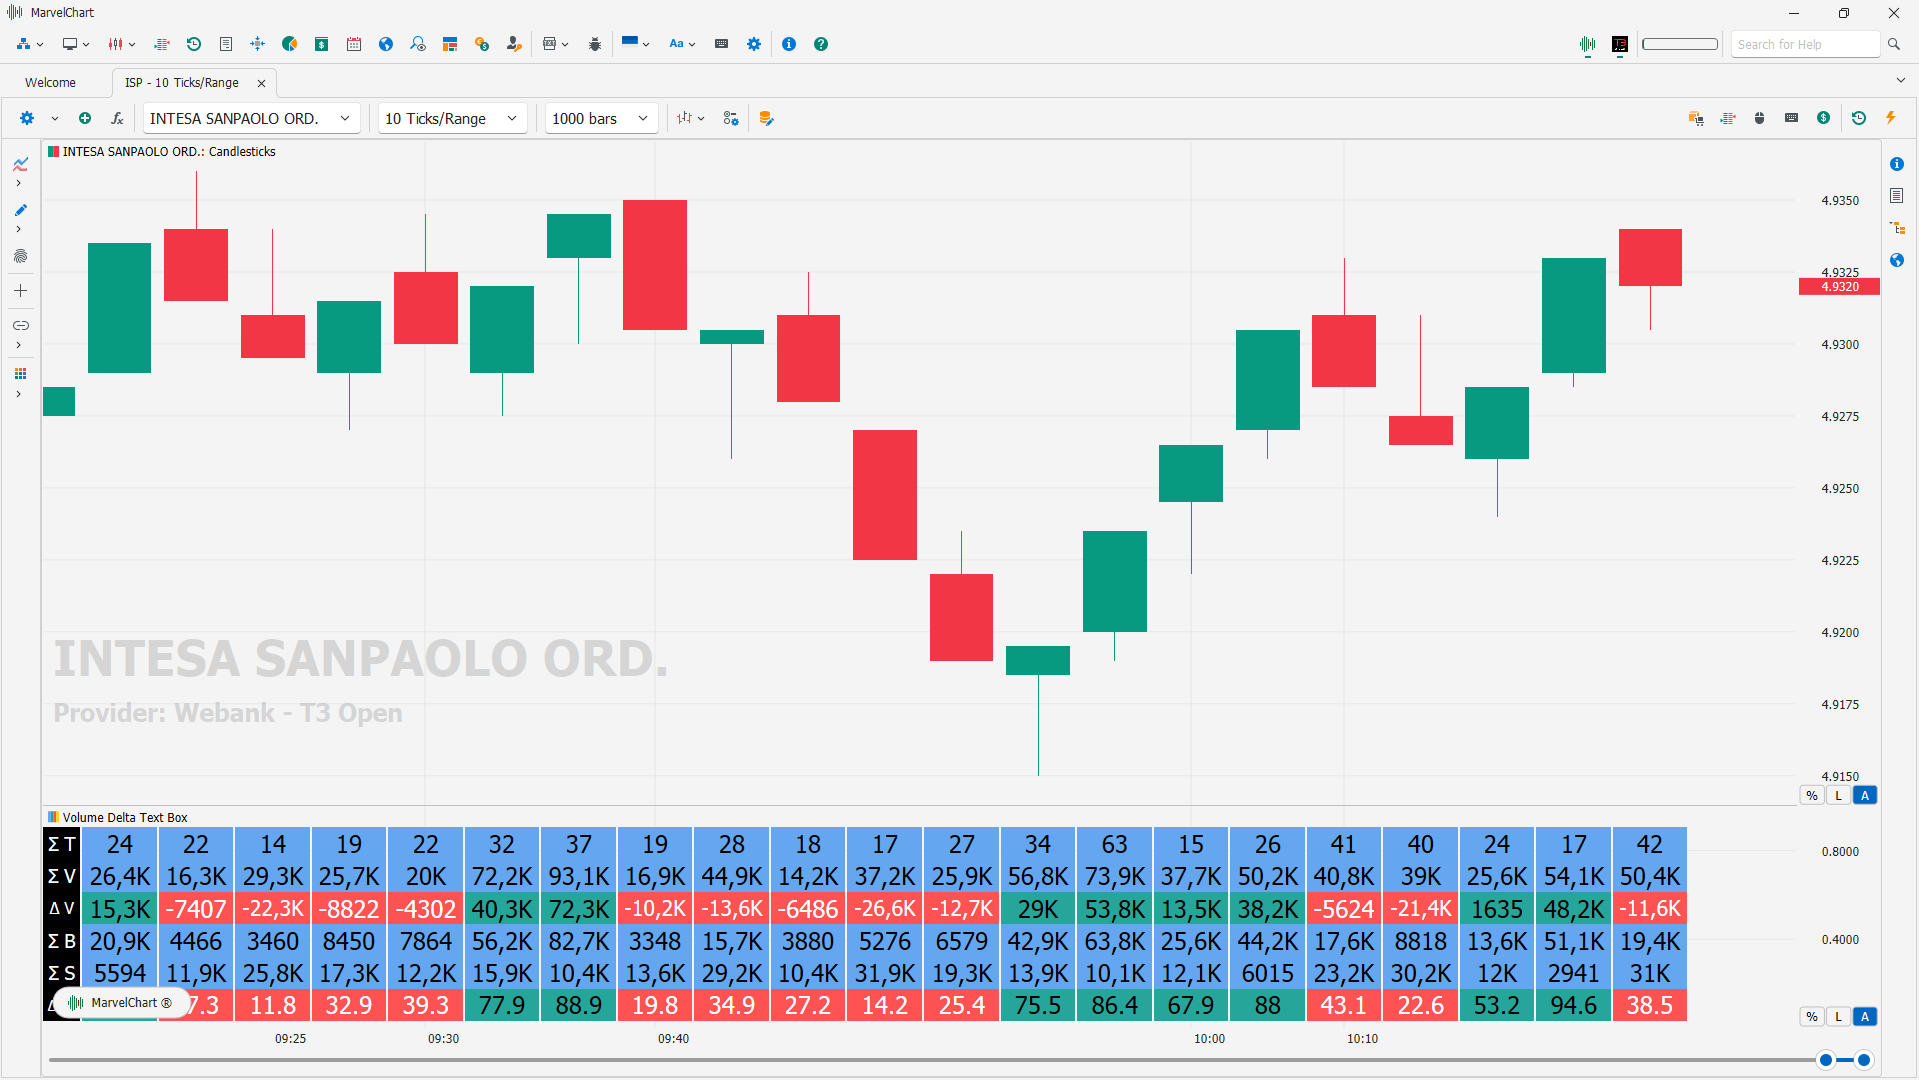
The Volume Delta Text Box indicator displays bar's volume metrics in numeric form. The available per bar metrics are:
Total number of Trades
Total Volume
Total Buy Volume
Total Sell Volume
Volume Delta, equal to Total Buy Volume - Total Sell Volume
Volume Delta, expressed in % of Total Volume
Volume Pressure
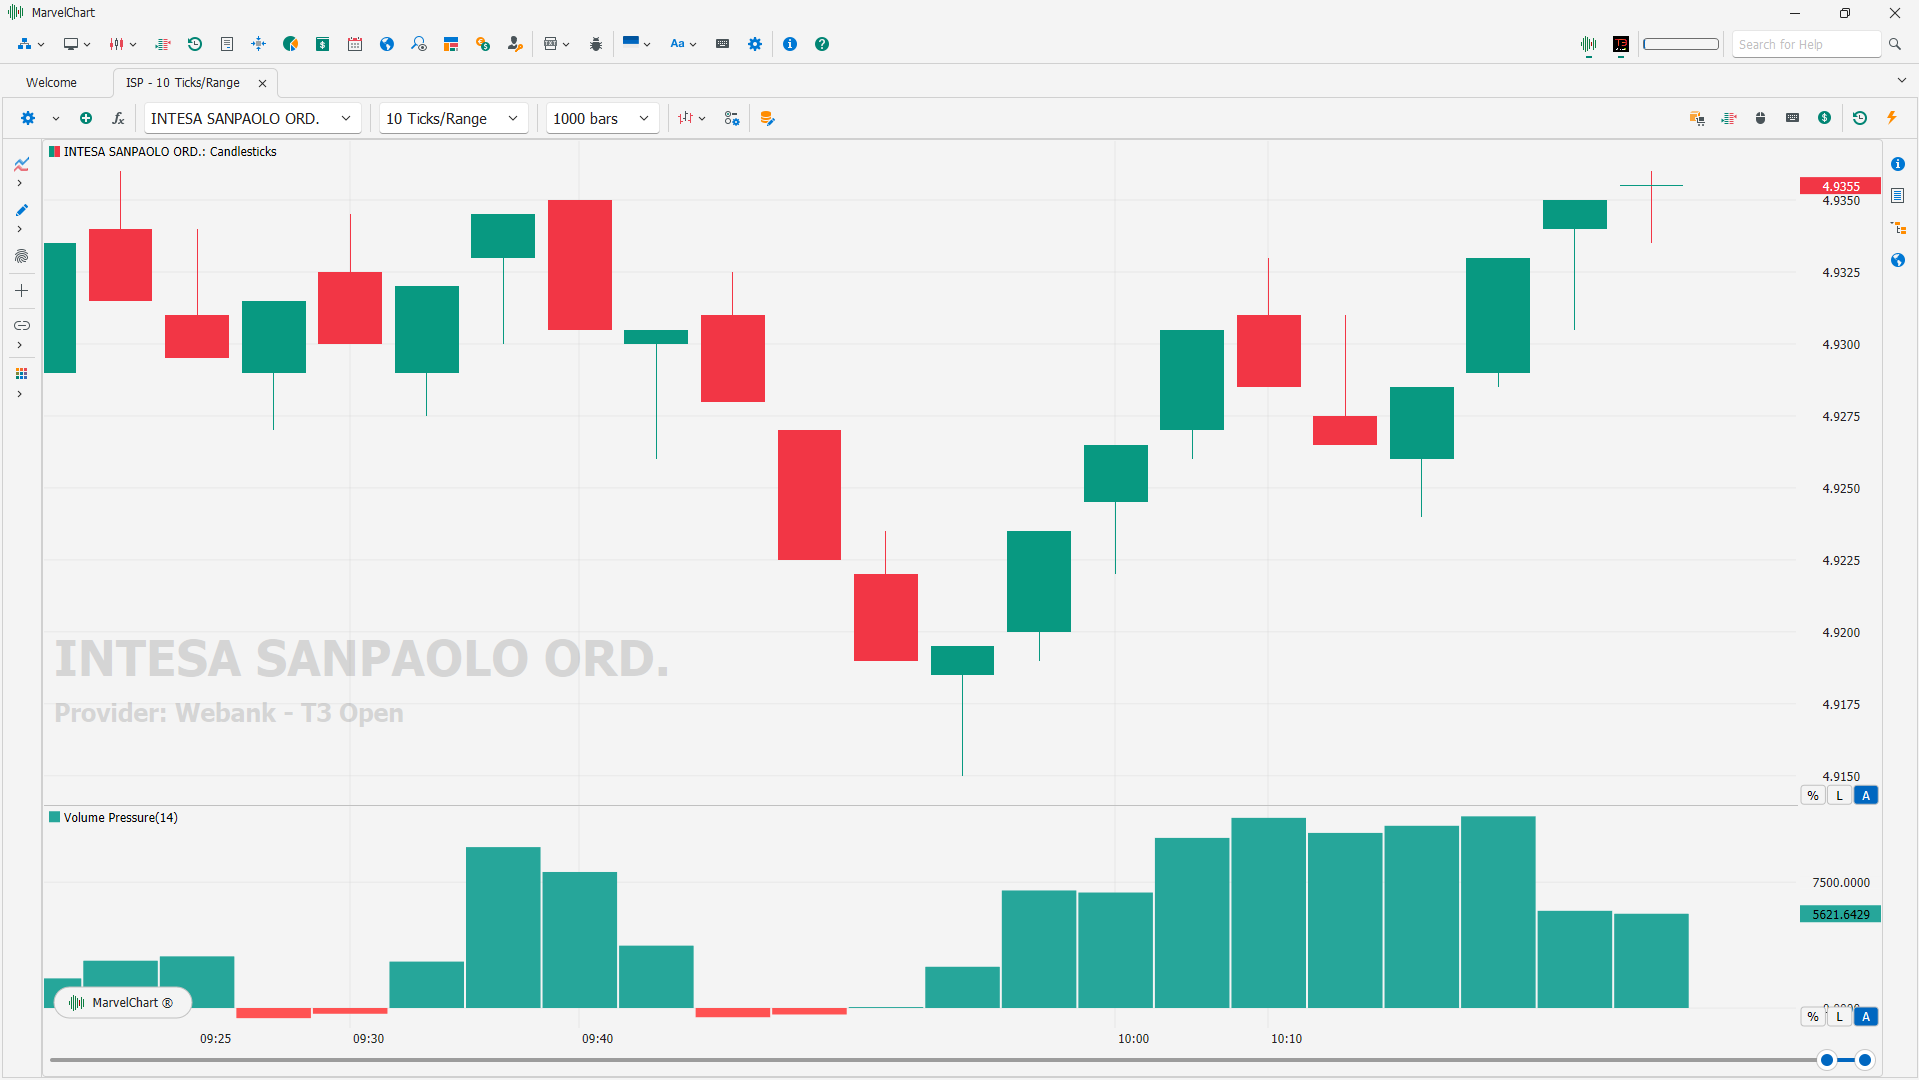
The Volume Pressure indicator displays the pressure on bid/ask prices using an average of the Volume Delta.
Volume Speed
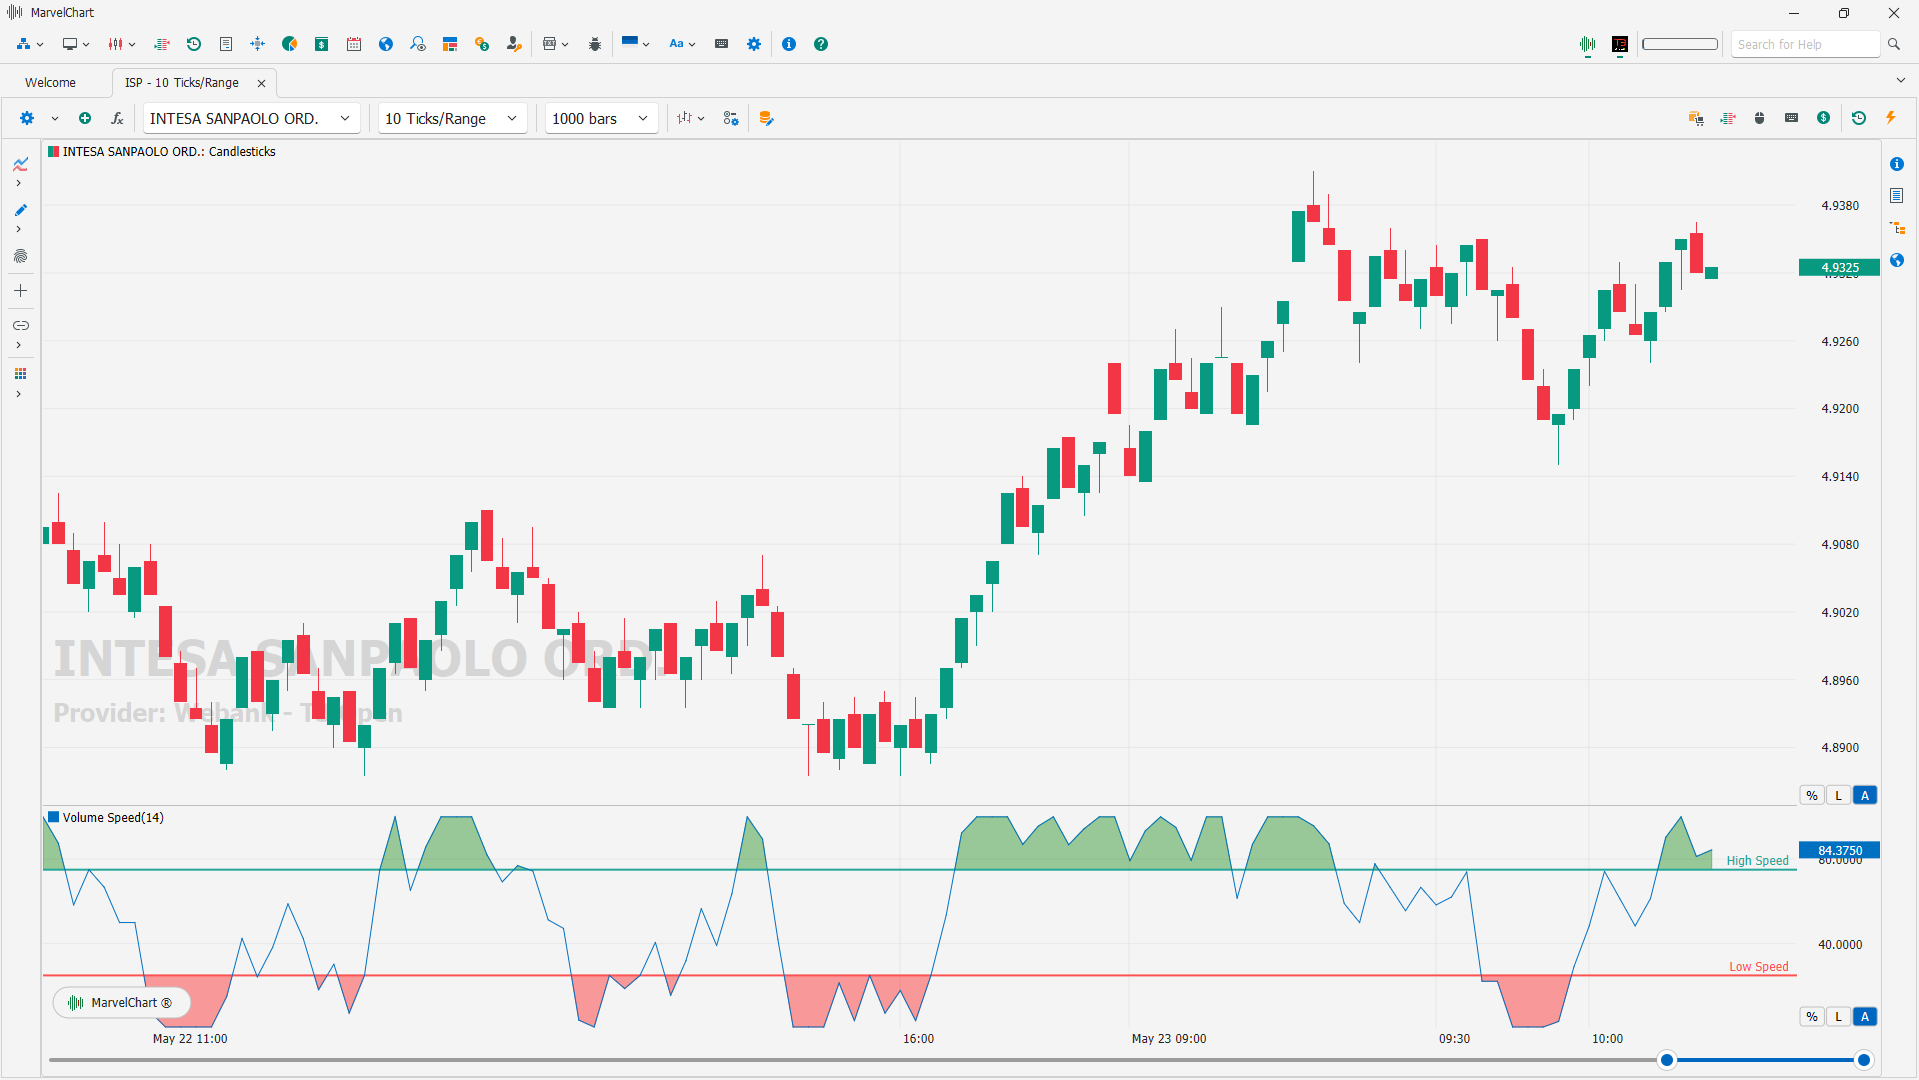
The Volume Speed indicator measures the speed at which the trades are filled. The result is shown as an oscillator in order to highlight when the speed is high or low.
Volume Zone Oscillator
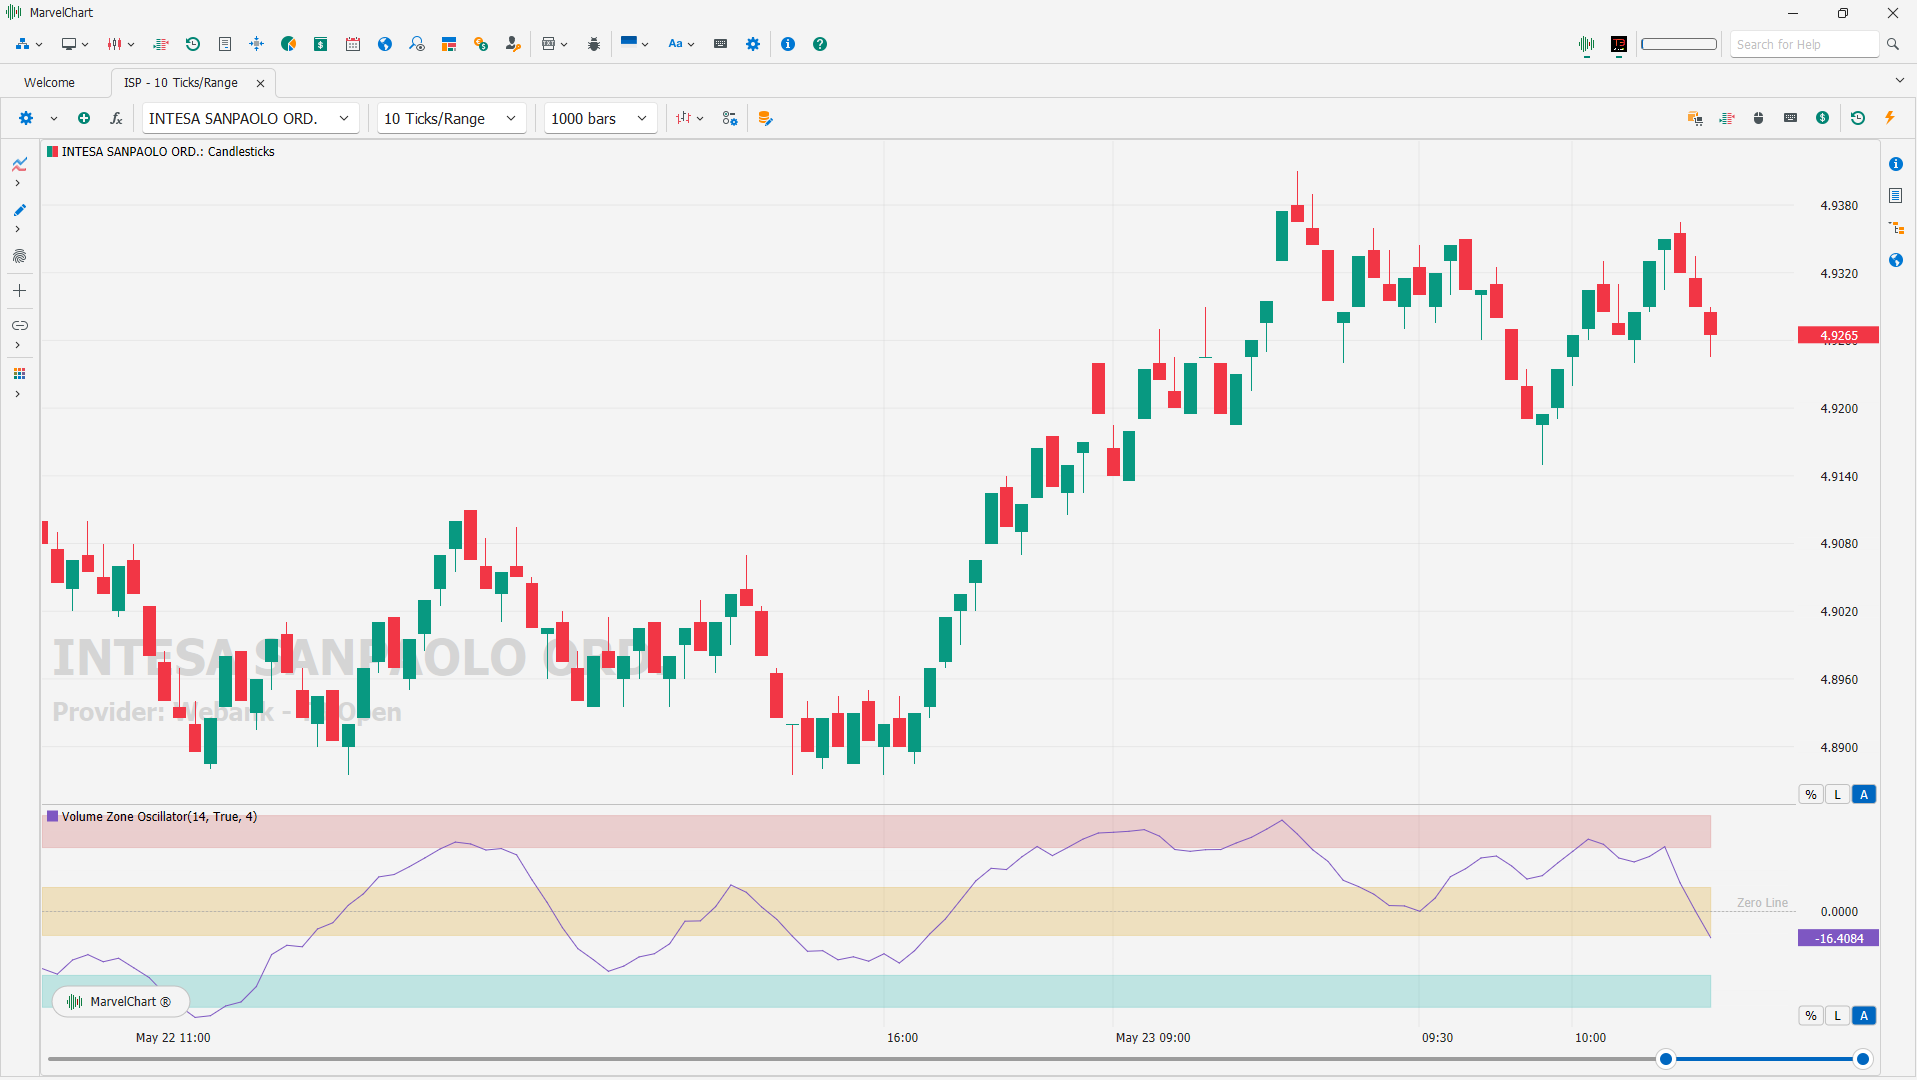
The Volume Zone Oscillator (VZO) is a technical indicator that analyzes volume changes in relation to price levels, using two moving averages to calculate its value. Unlike some volume indicators that focus solely on volume momentum, VZO integrates price and volume data, allowing for a more nuanced understanding of market pressure and potential trend reversals.
Key Features of VZO
Price and Volume Integration: VZO uses both price and volume data to create its oscillator;
Two Moving Averages: it calculates two moving averages, one related to price and the other to volume;
Oscillator with Zones: the VZO produces an oscillator that ranges from -100 to +100, with values within these zones indicating overbought/oversold conditions;
Identification of Market Pressure: by separating volume into positive and negative zones based on price direction, VZO helps identify market pressure and potential trend shifts;
Buy/Sell Signals: VZO can be used to generate buy and sell signals based on its movement within these zones, often in conjunction with other indicators like ADX and EMA.
In essence, VZO provides a way to visualize volume dynamics within a price context, offering insights into market strength and potential trend reversals based on the relationship between price and volume.