Prices
Highest High
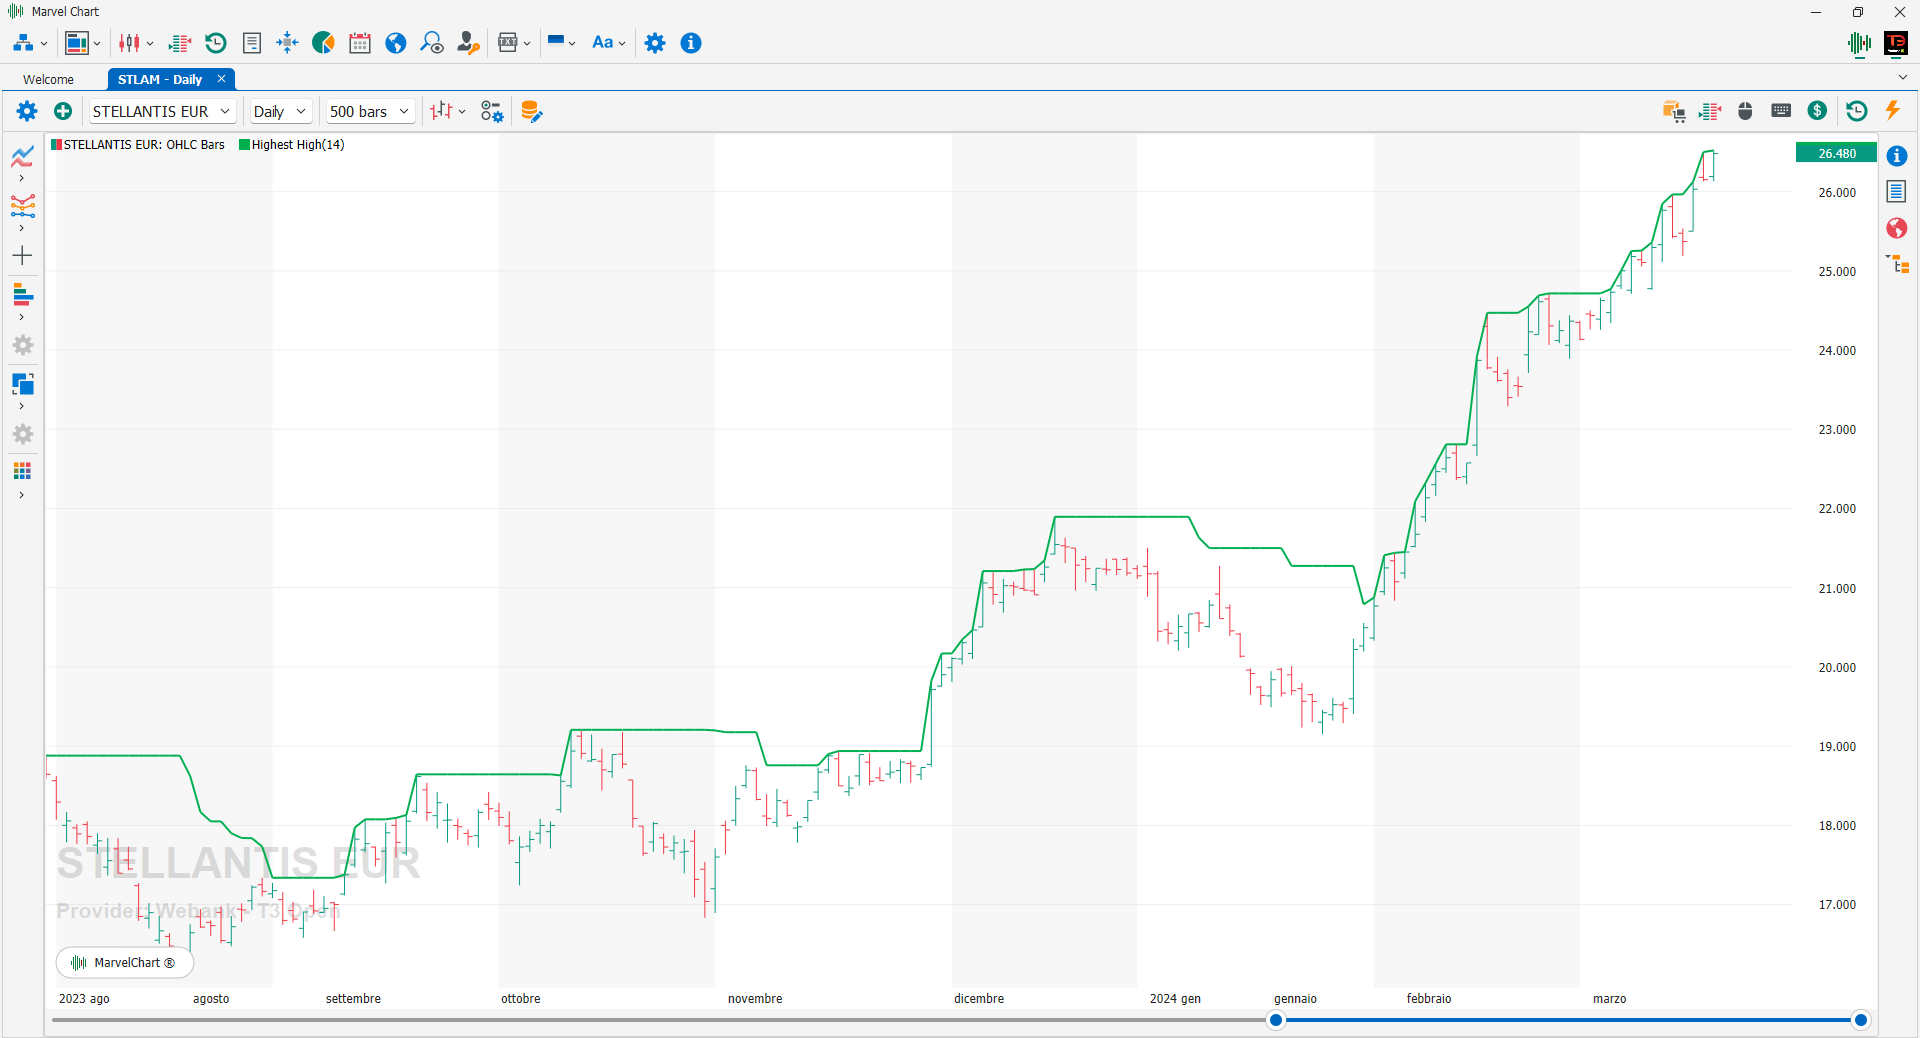
The Highest High indicator, as its name suggests, creates a line that connects the highest HIGH values reached by the financial instrument in the selected period.
Lowest Low
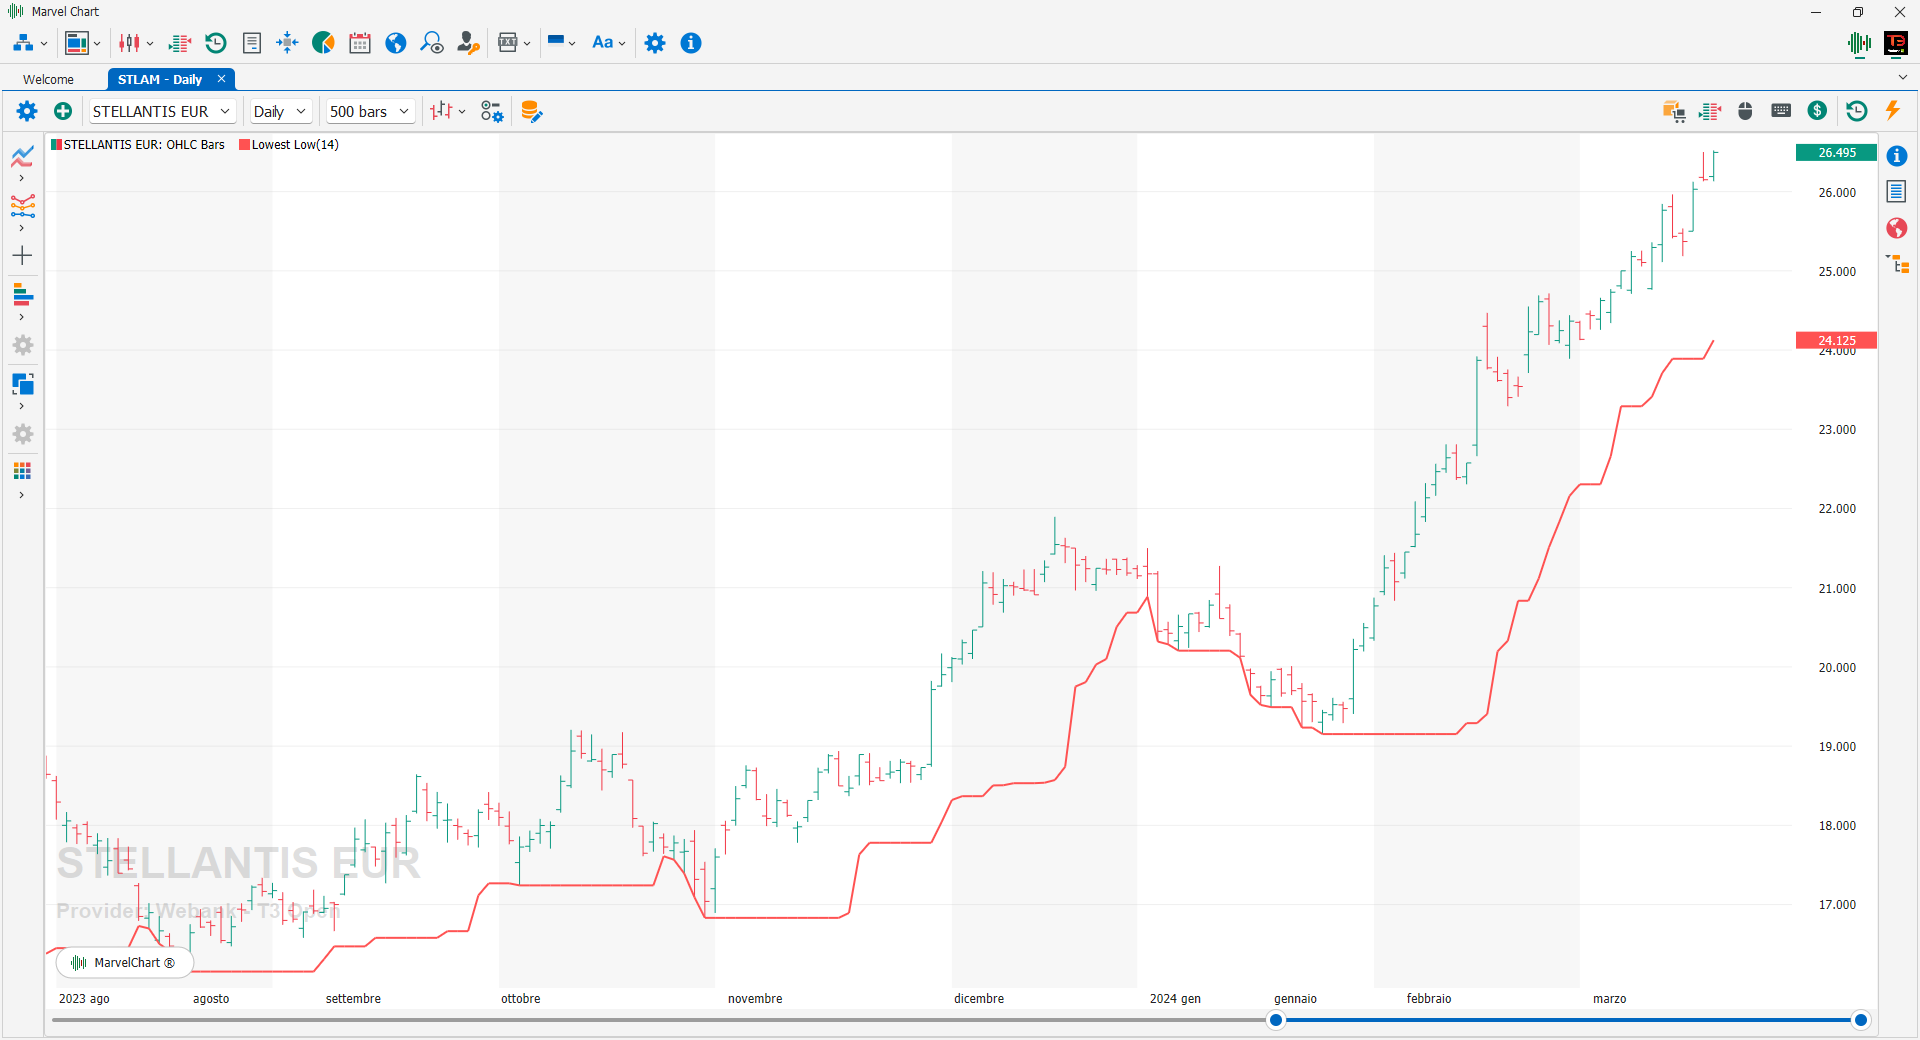
The Lowest Low indicator, as its name suggests, creates a line that joins the minimum LOW values reached by the financial instrument in the selected period.
Median Price (HL2)
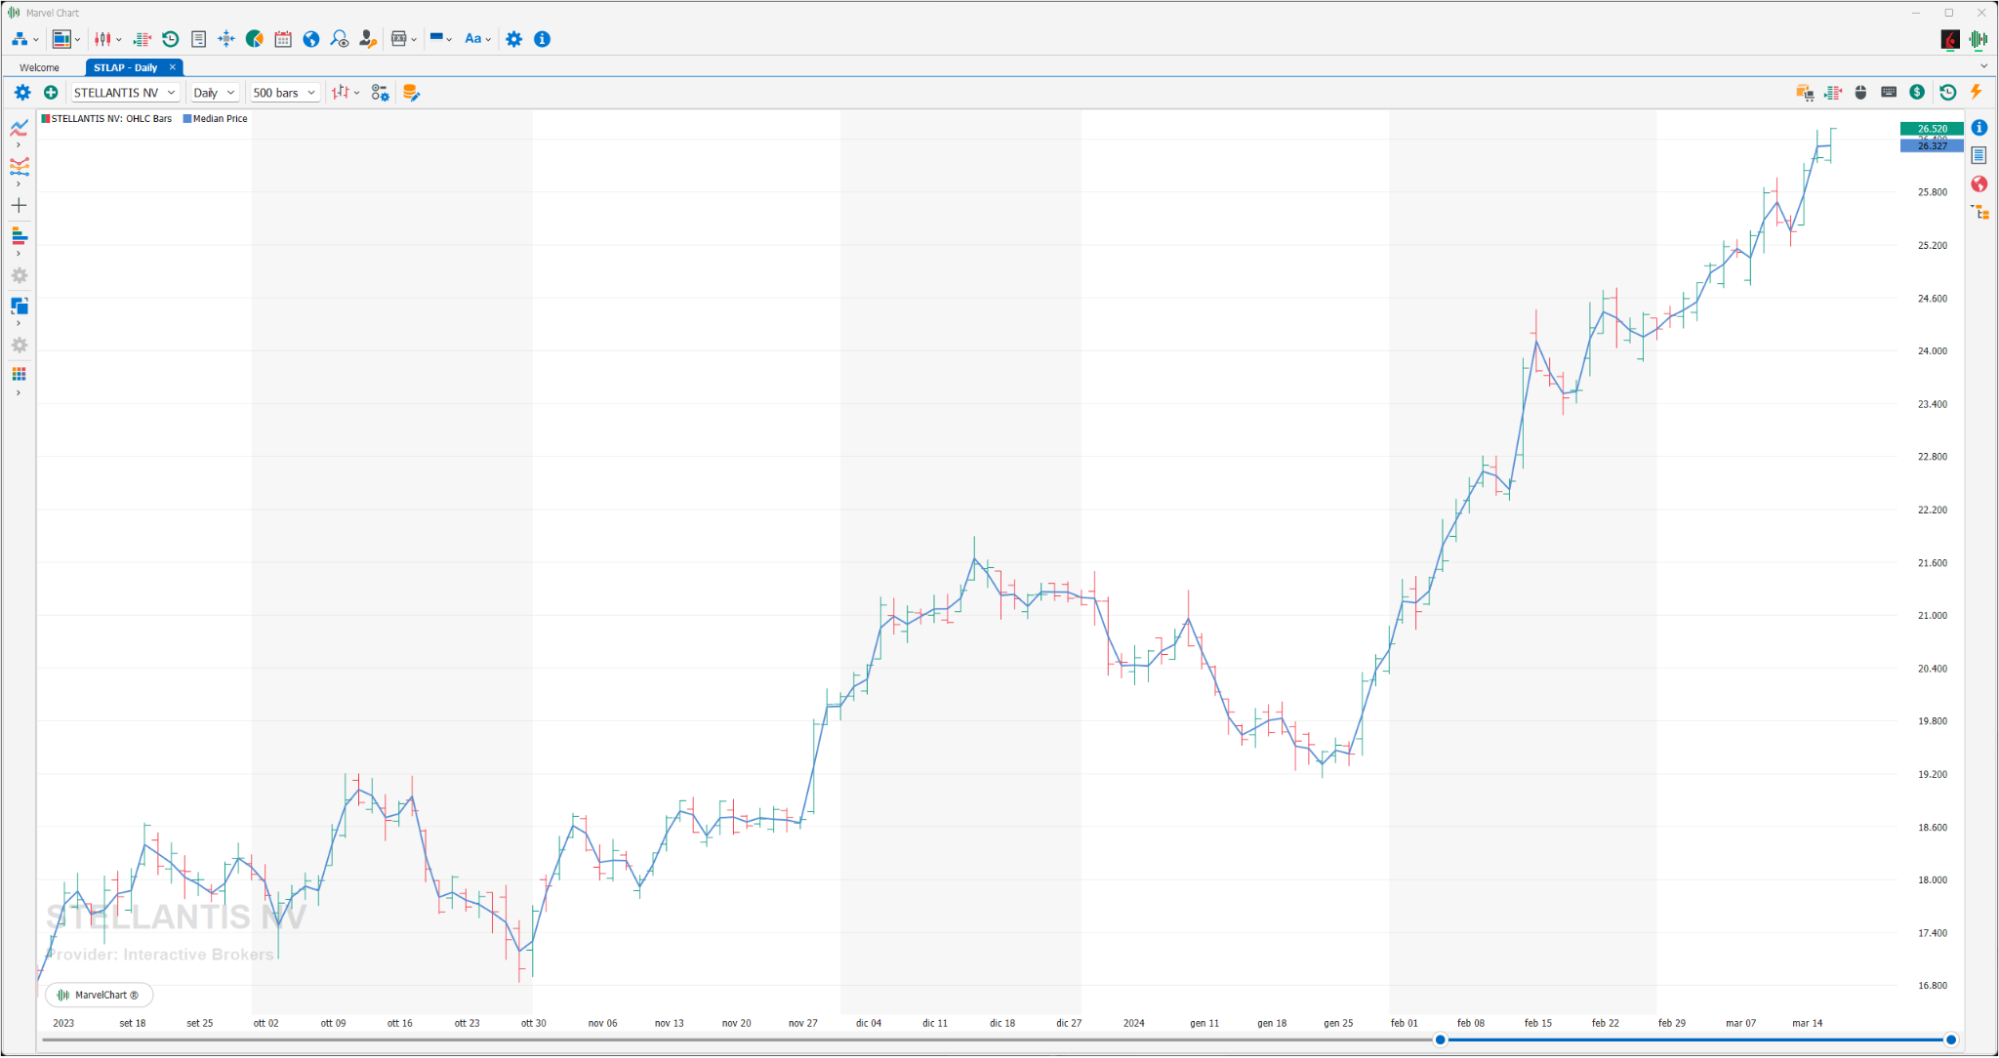
The Median Price is an easy-to-understand indicator formed by the average price of each bar over the period of time considered.
Moving Median
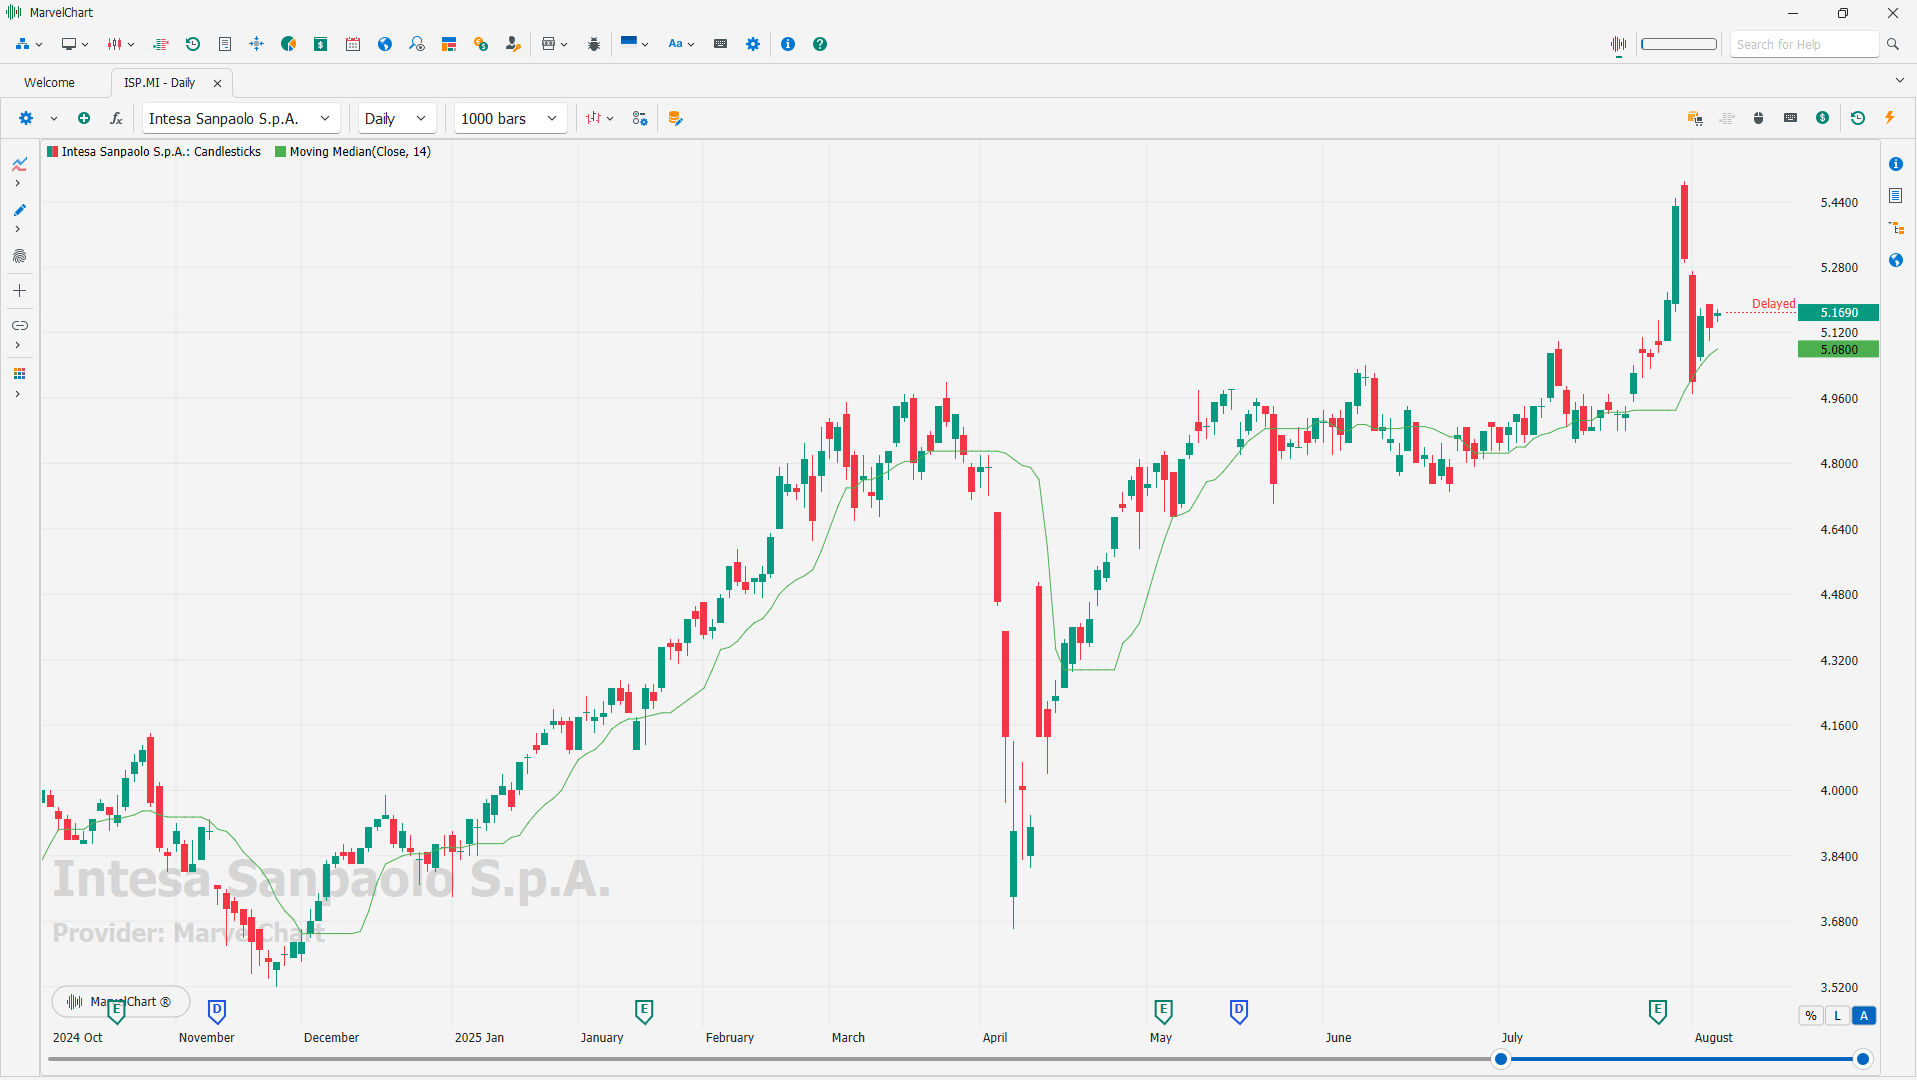
A moving median is a technical indicator that calculates the median value of a data set over a sliding window of data points. It's a type of moving average that is more robust to outliers than a traditional simple moving average (SMA). By using the median, it reduces the impact of extreme values on the indicator's calculation, making it a useful tool for identifying trends and potential support and resistance levels.
How it works
Define a window: A specific number of data points (e.g., 10 periods) is selected as the window.
Sort the data: Within that window, the data points are sorted from lowest to highest.
Calculate the median: The median is the middle value in the sorted data. If there's an even number of data points, the median is the average of the two middle values.
Slide the window: The window then moves forward, dropping the oldest data point and adding the newest one, and the median is recalculated.
Key differences from a moving average
Outlier sensitivity
Moving averages, especially simple moving averages, can be heavily influenced by extreme values. The moving median is less susceptible to this, as it only considers the middle value of the sorted data.
Smoothing
Moving medians tend to be smoother than moving averages, especially in the presence of volatile price action.
Applications
Trend identification
Similar to moving averages, moving medians can help traders identify the overall trend of a security. A rising moving median suggests an uptrend, while a falling one suggests a downtrend.
Support and resistance
Moving medians can act as dynamic support and resistance levels. Price often bounces off these levels, especially in trending markets.
Filter out noise
Moving medians can help filter out short-term price fluctuations, making it easier to see the underlying trend.
OHLC Average (OHLC4)
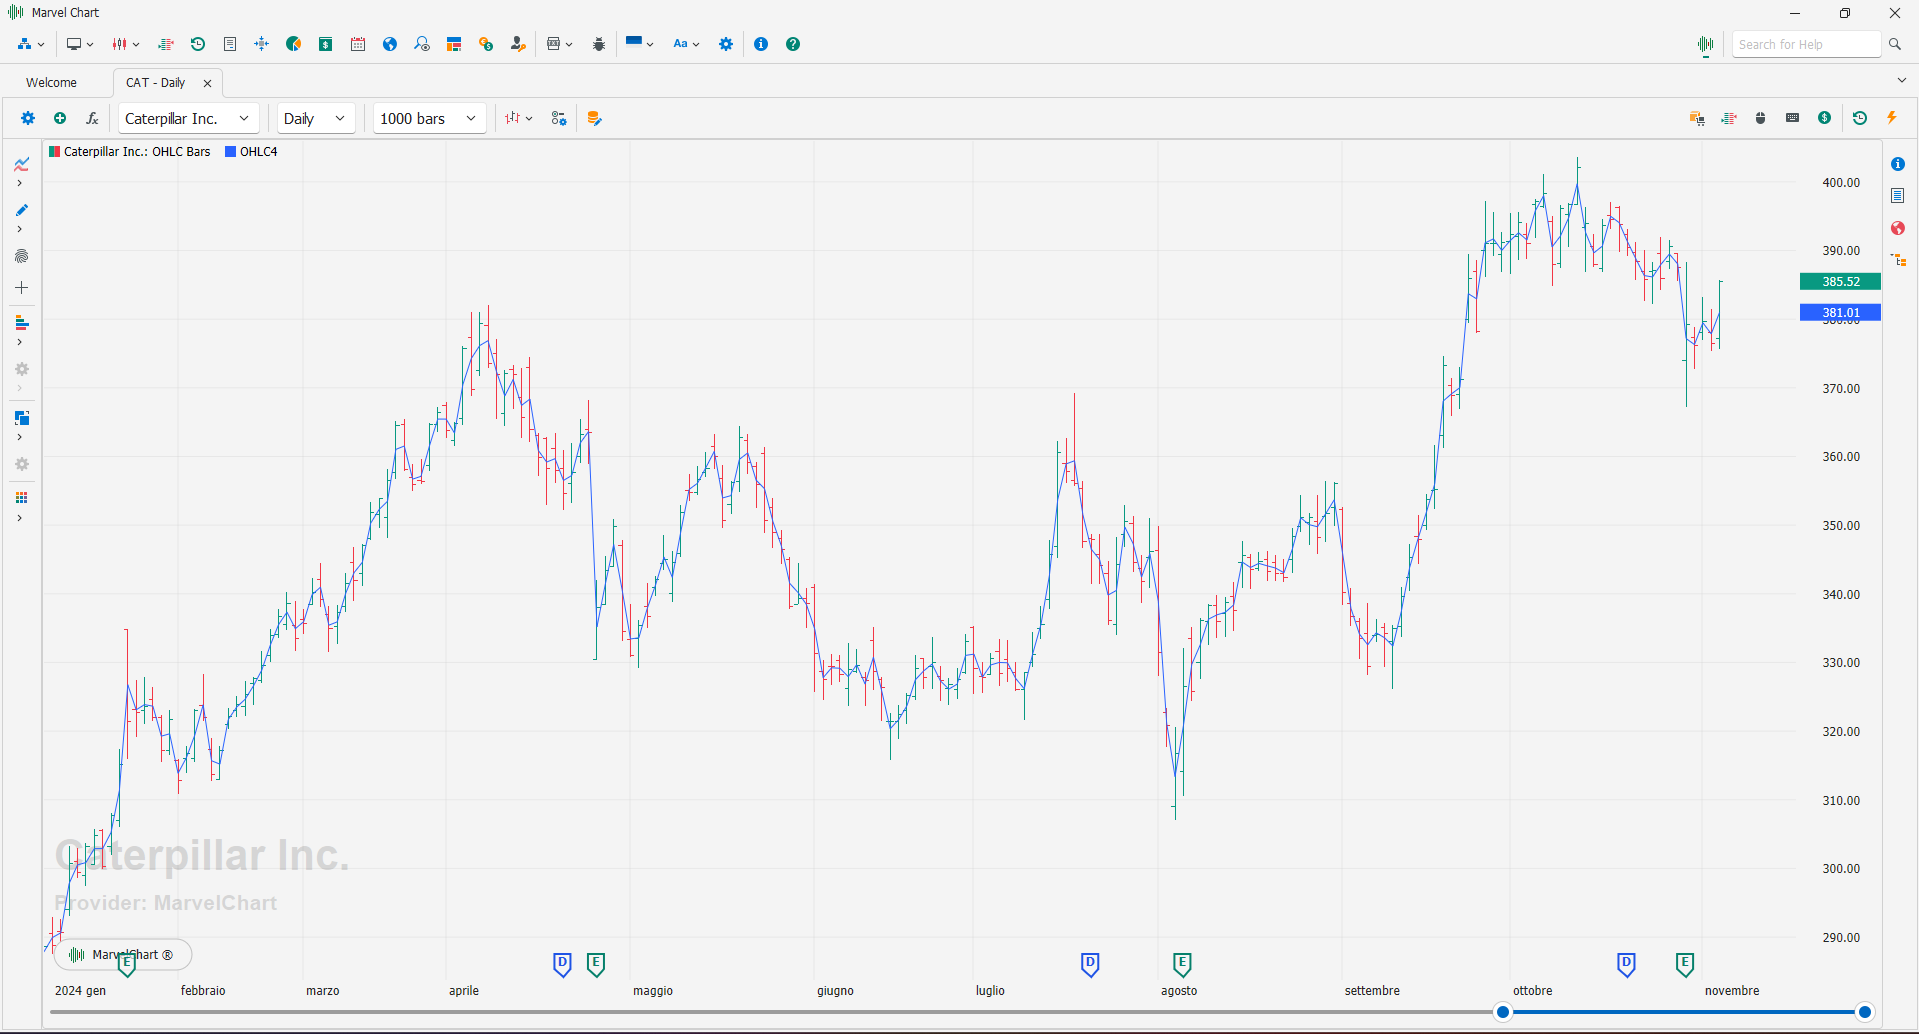
The OHLC Average is an easy-to-understand indicator formed by the average of each bar prices over the period of time considered.
Today High
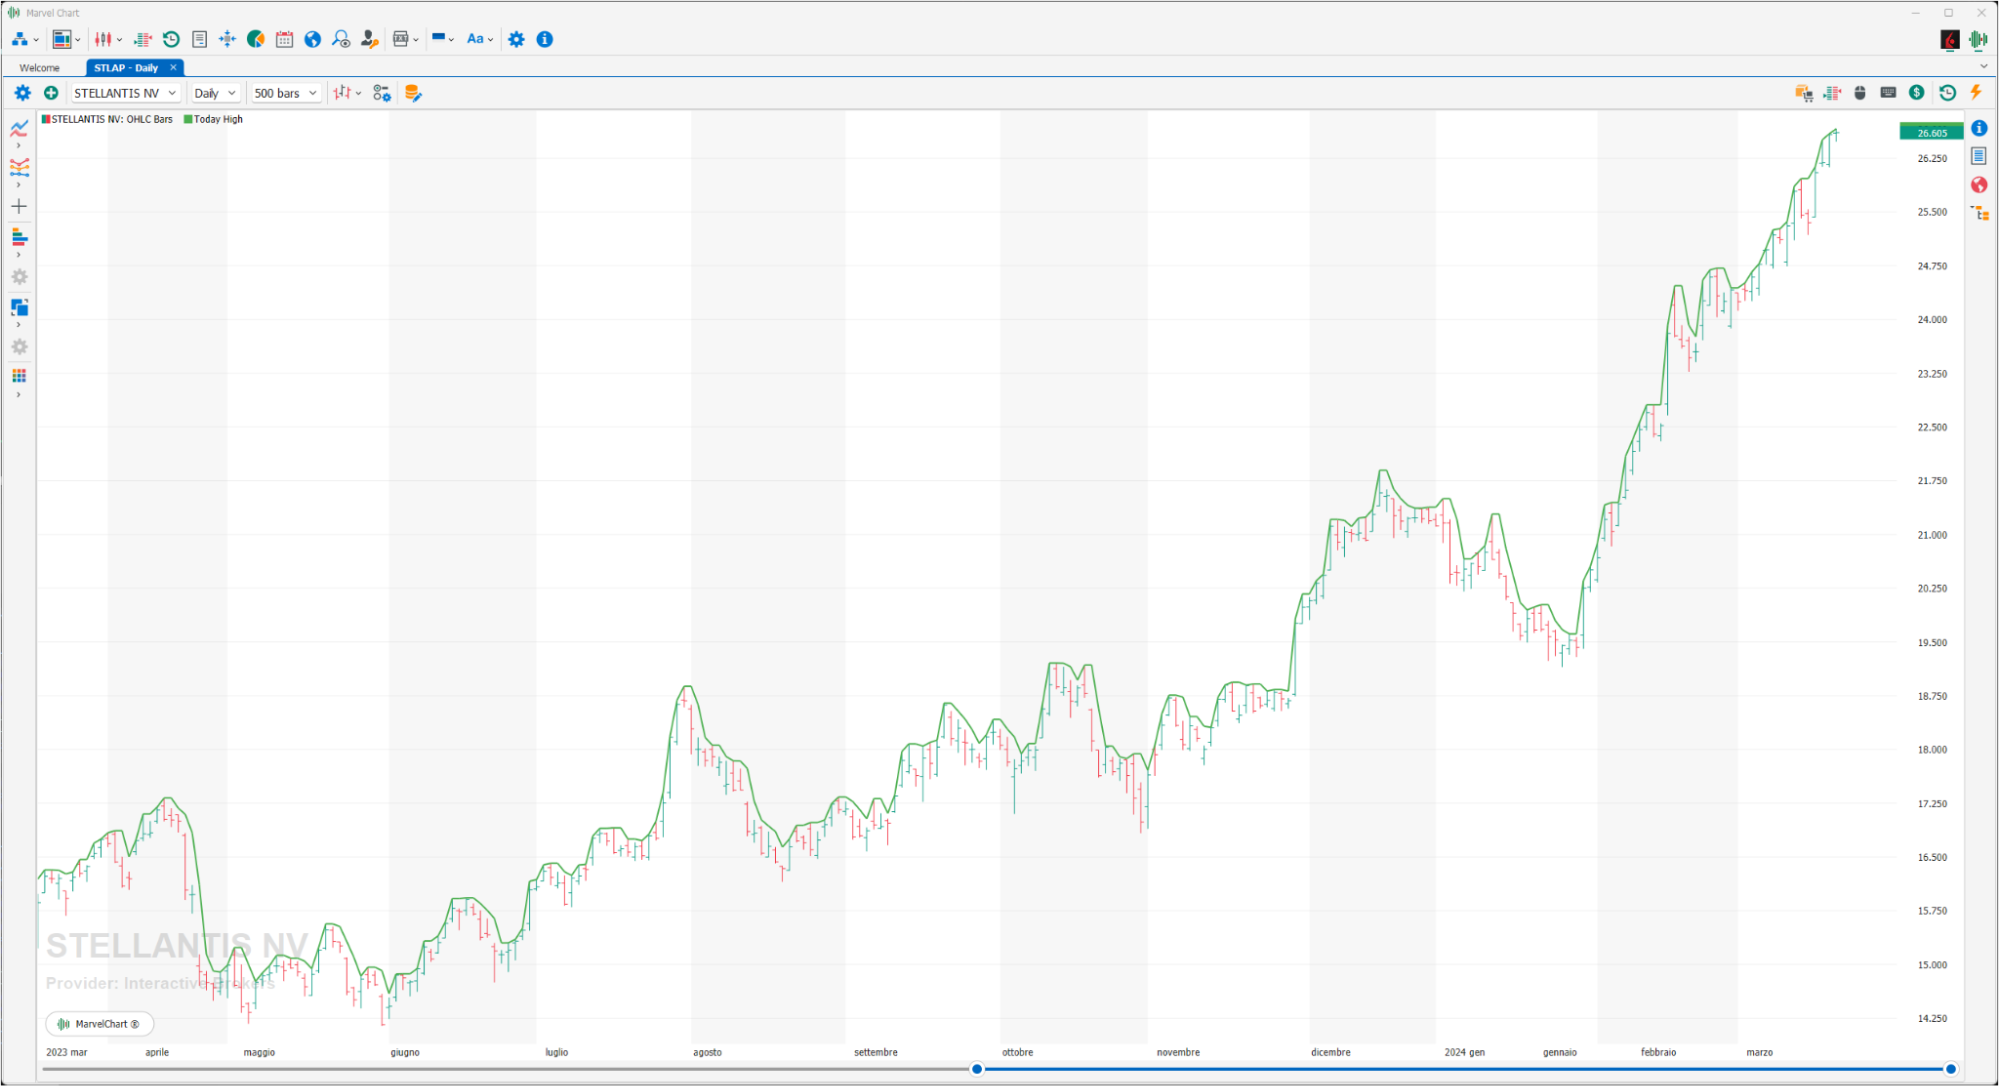
Gets the highest price of the current day.
Today Low
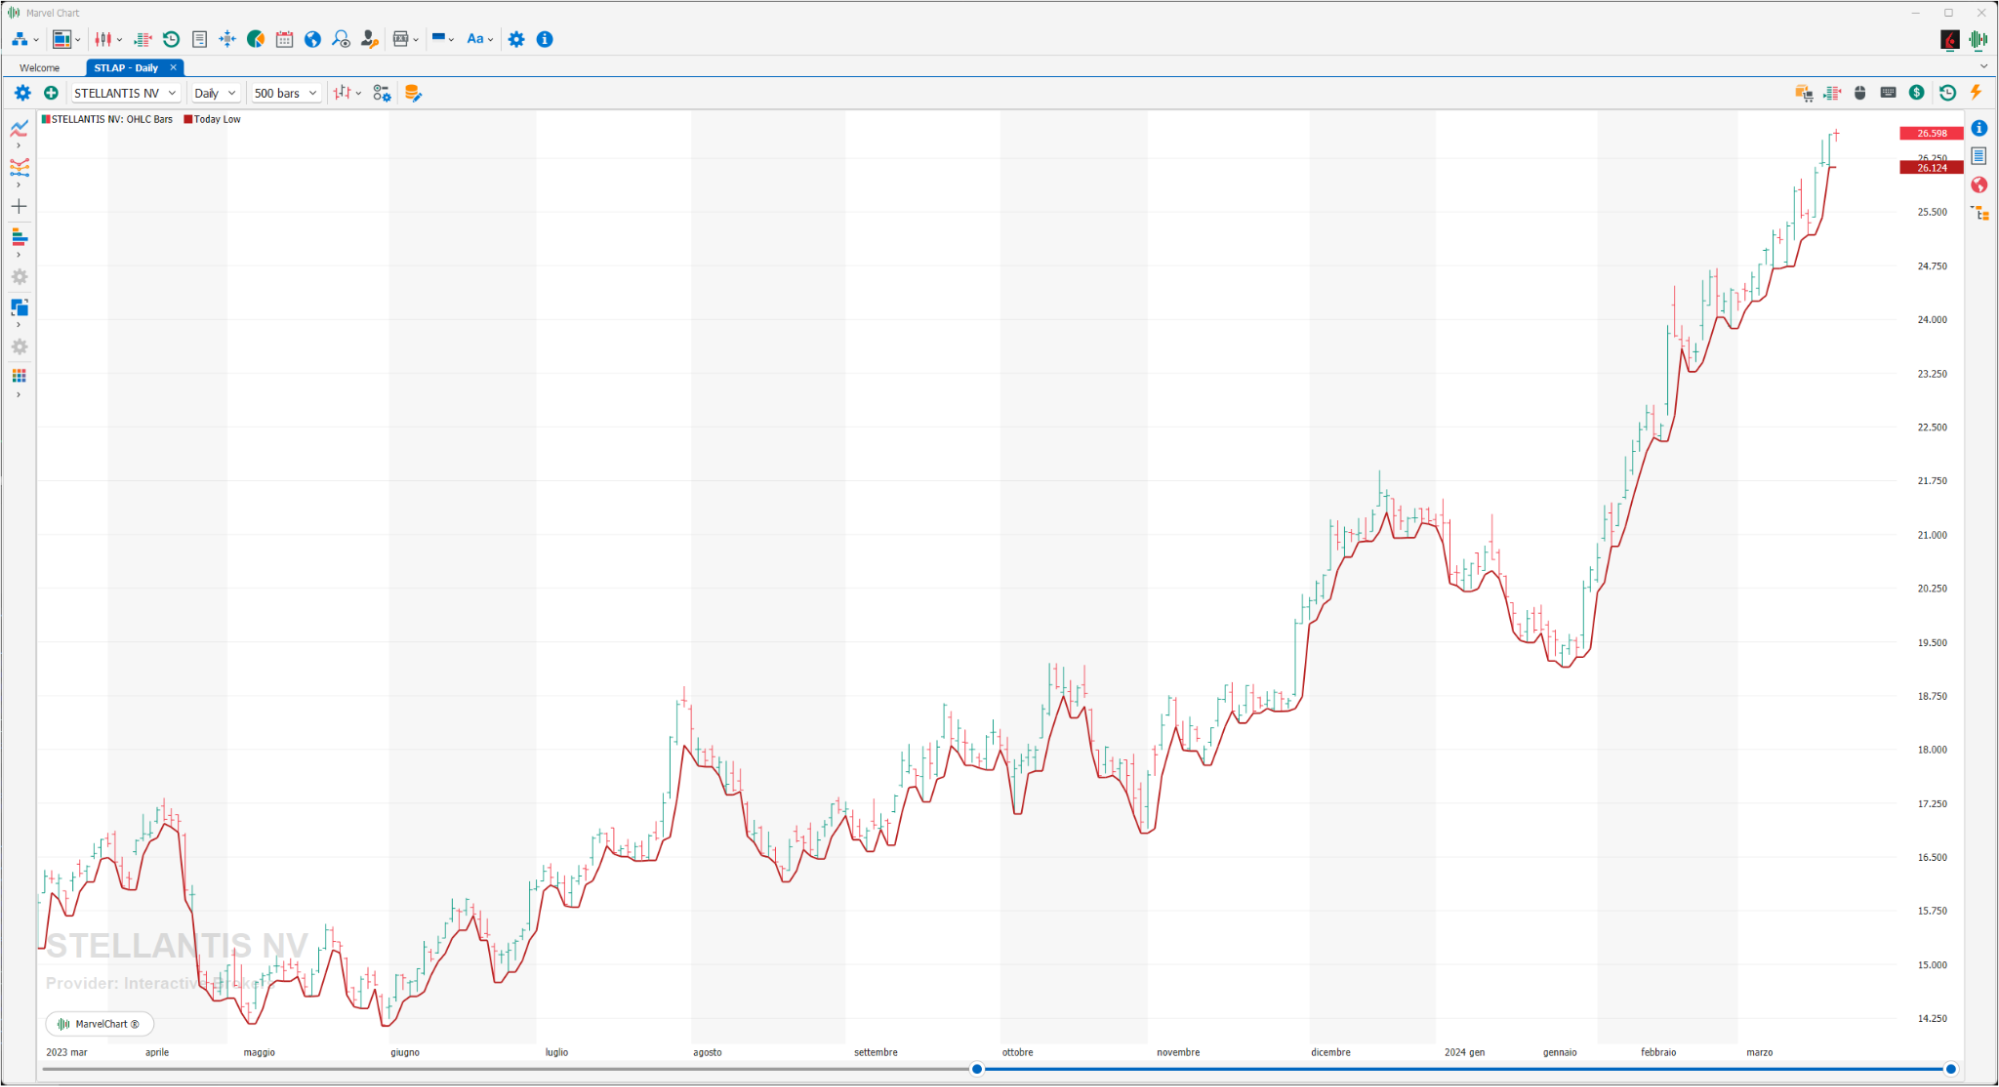
Gets the lowest price of the current day.
Today Open
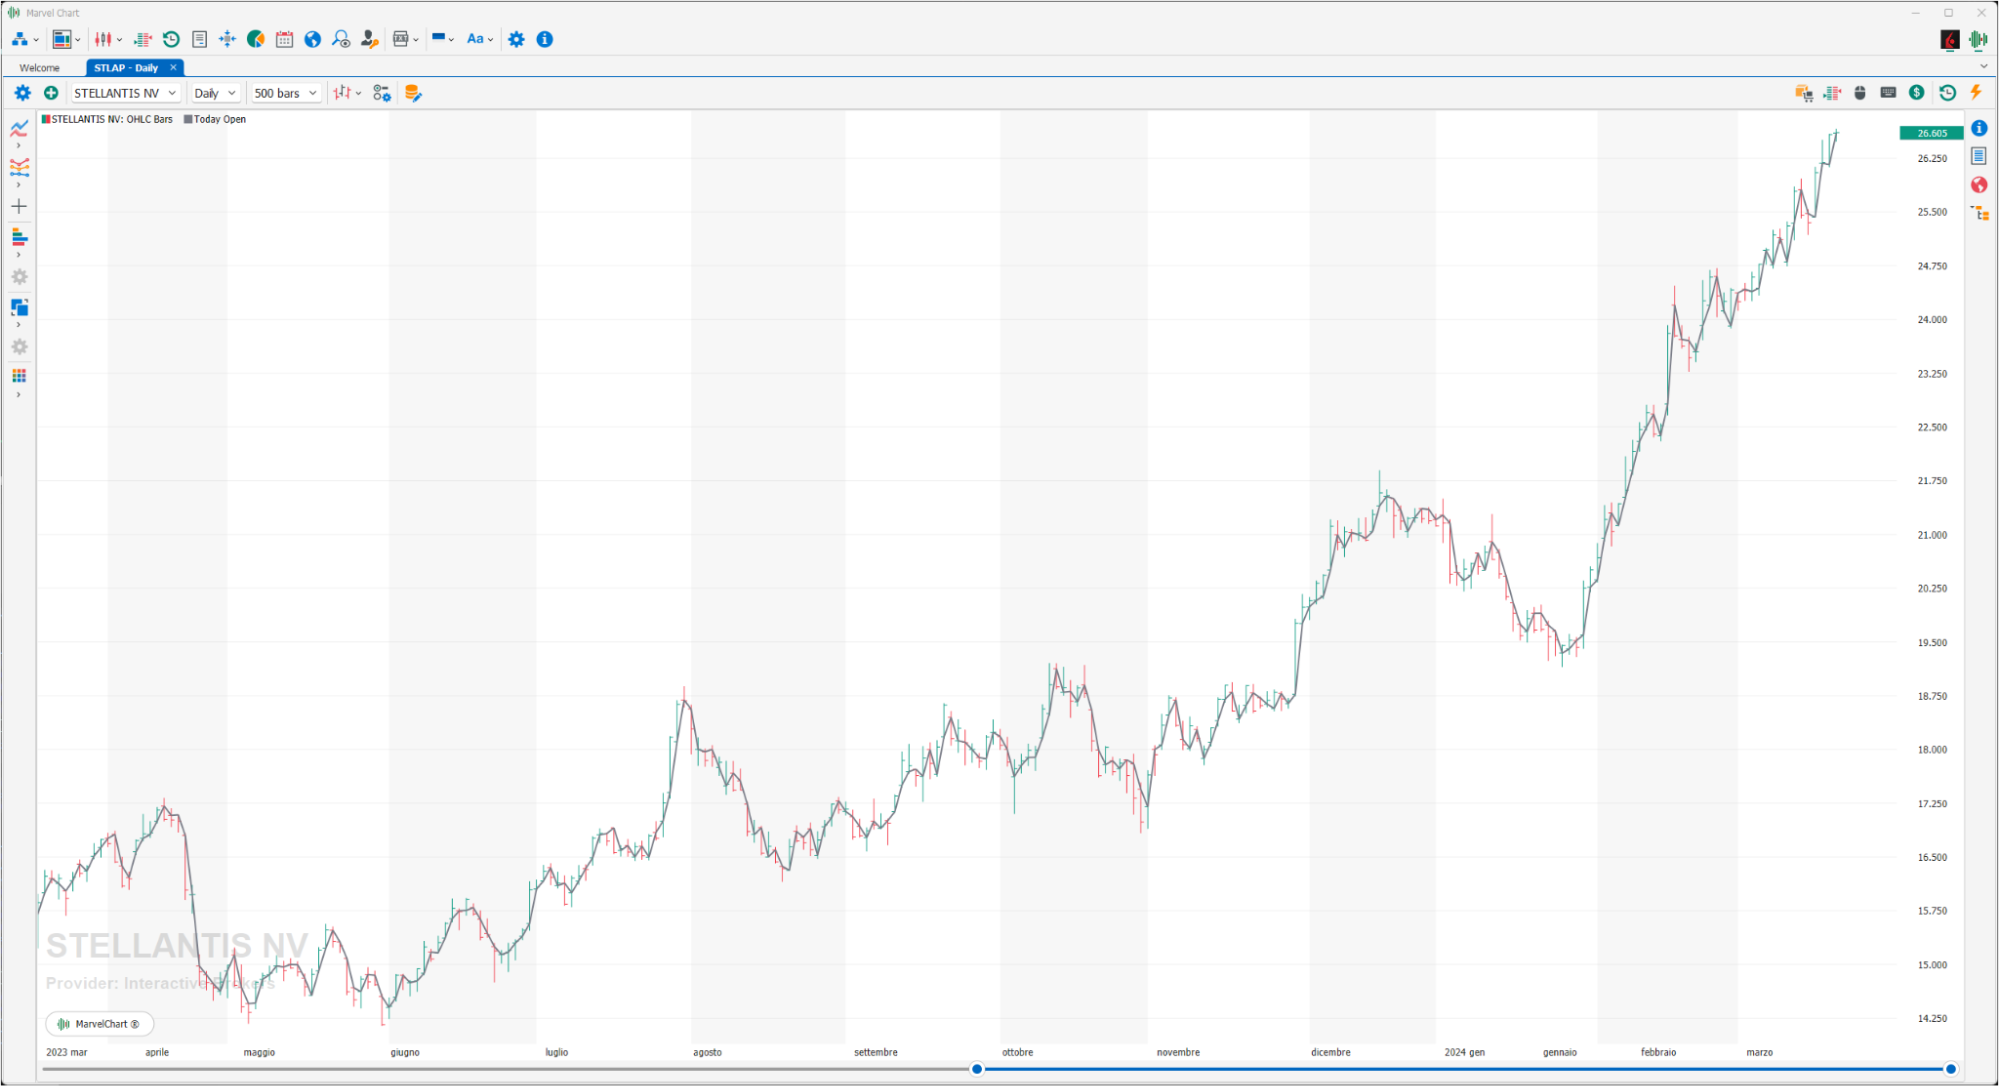
Gets the opening price of the current day.
True High
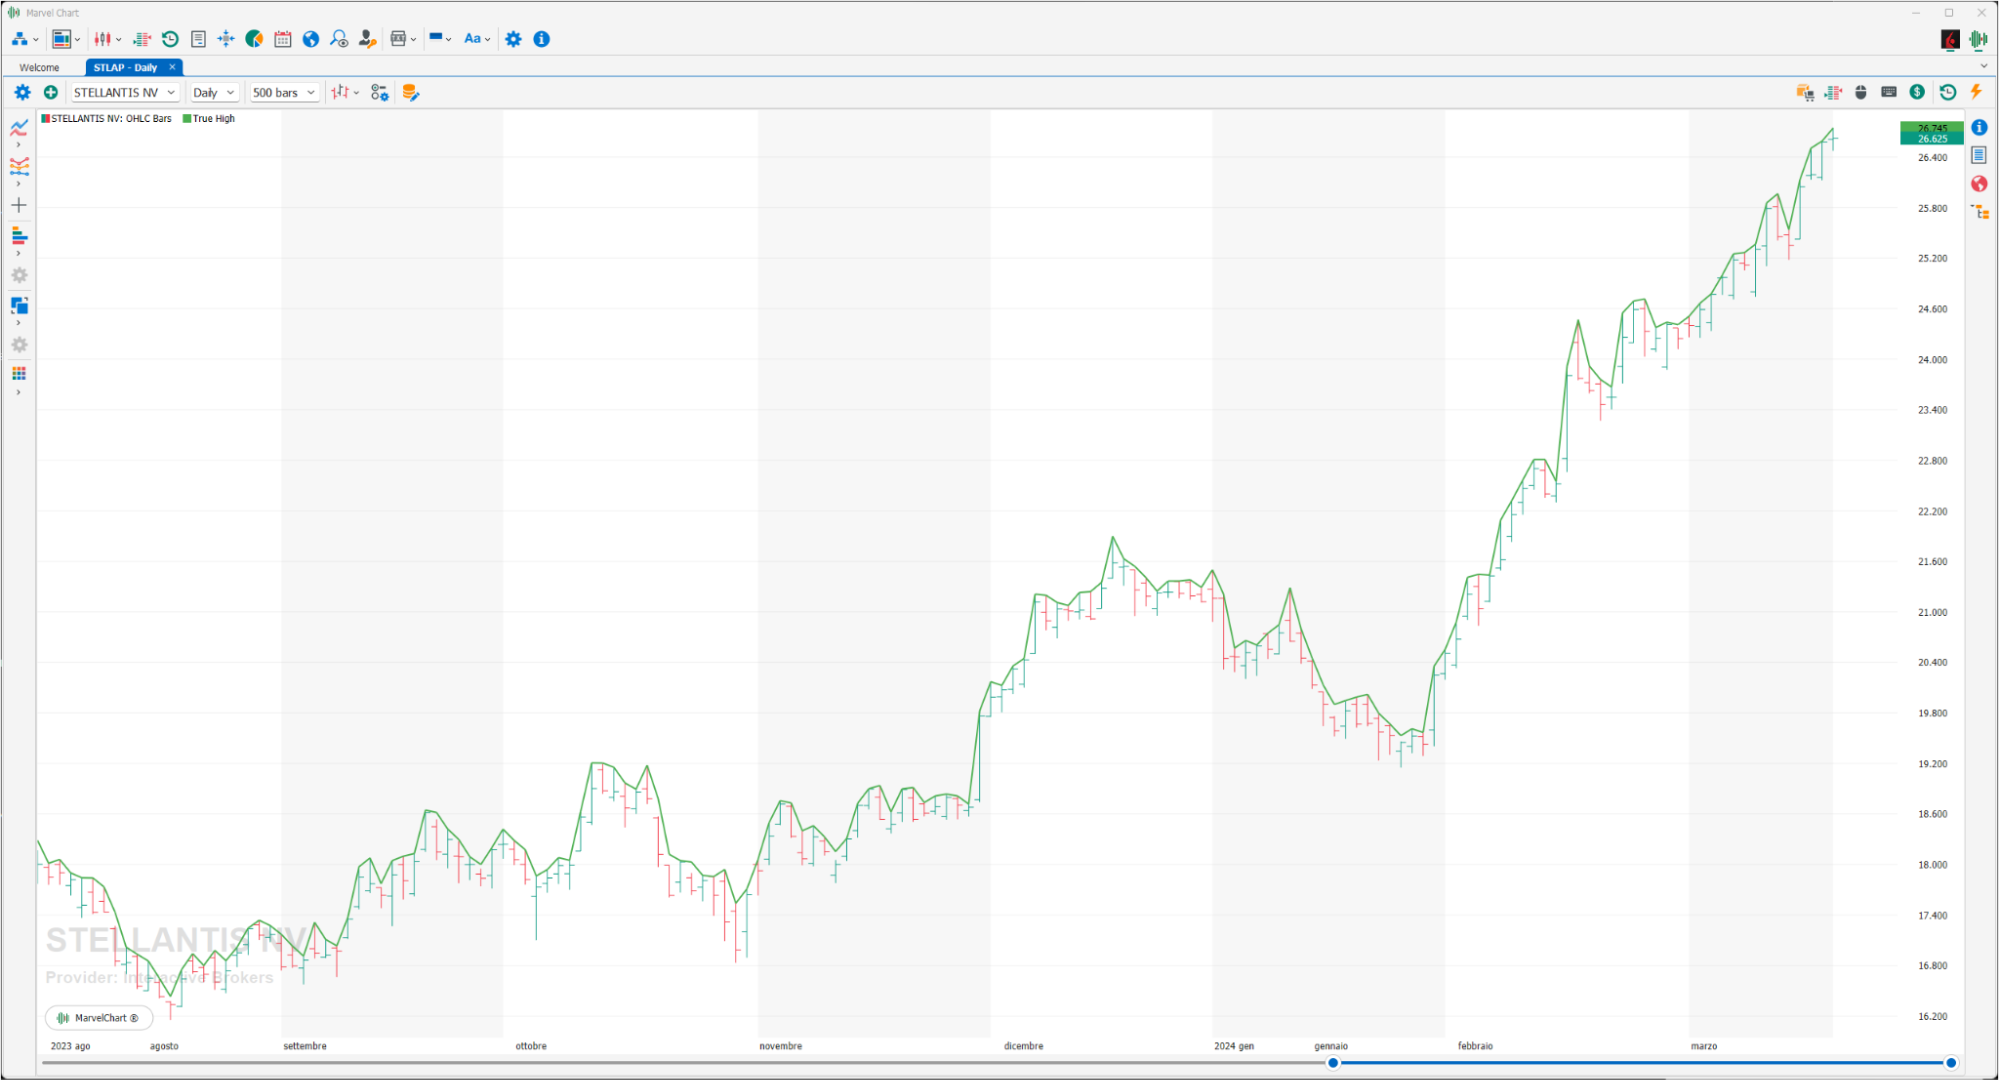
Simple indicator calculated by taking the highest values between the HIGH value of the current bar and the CLOSE of the previous one.
True Low
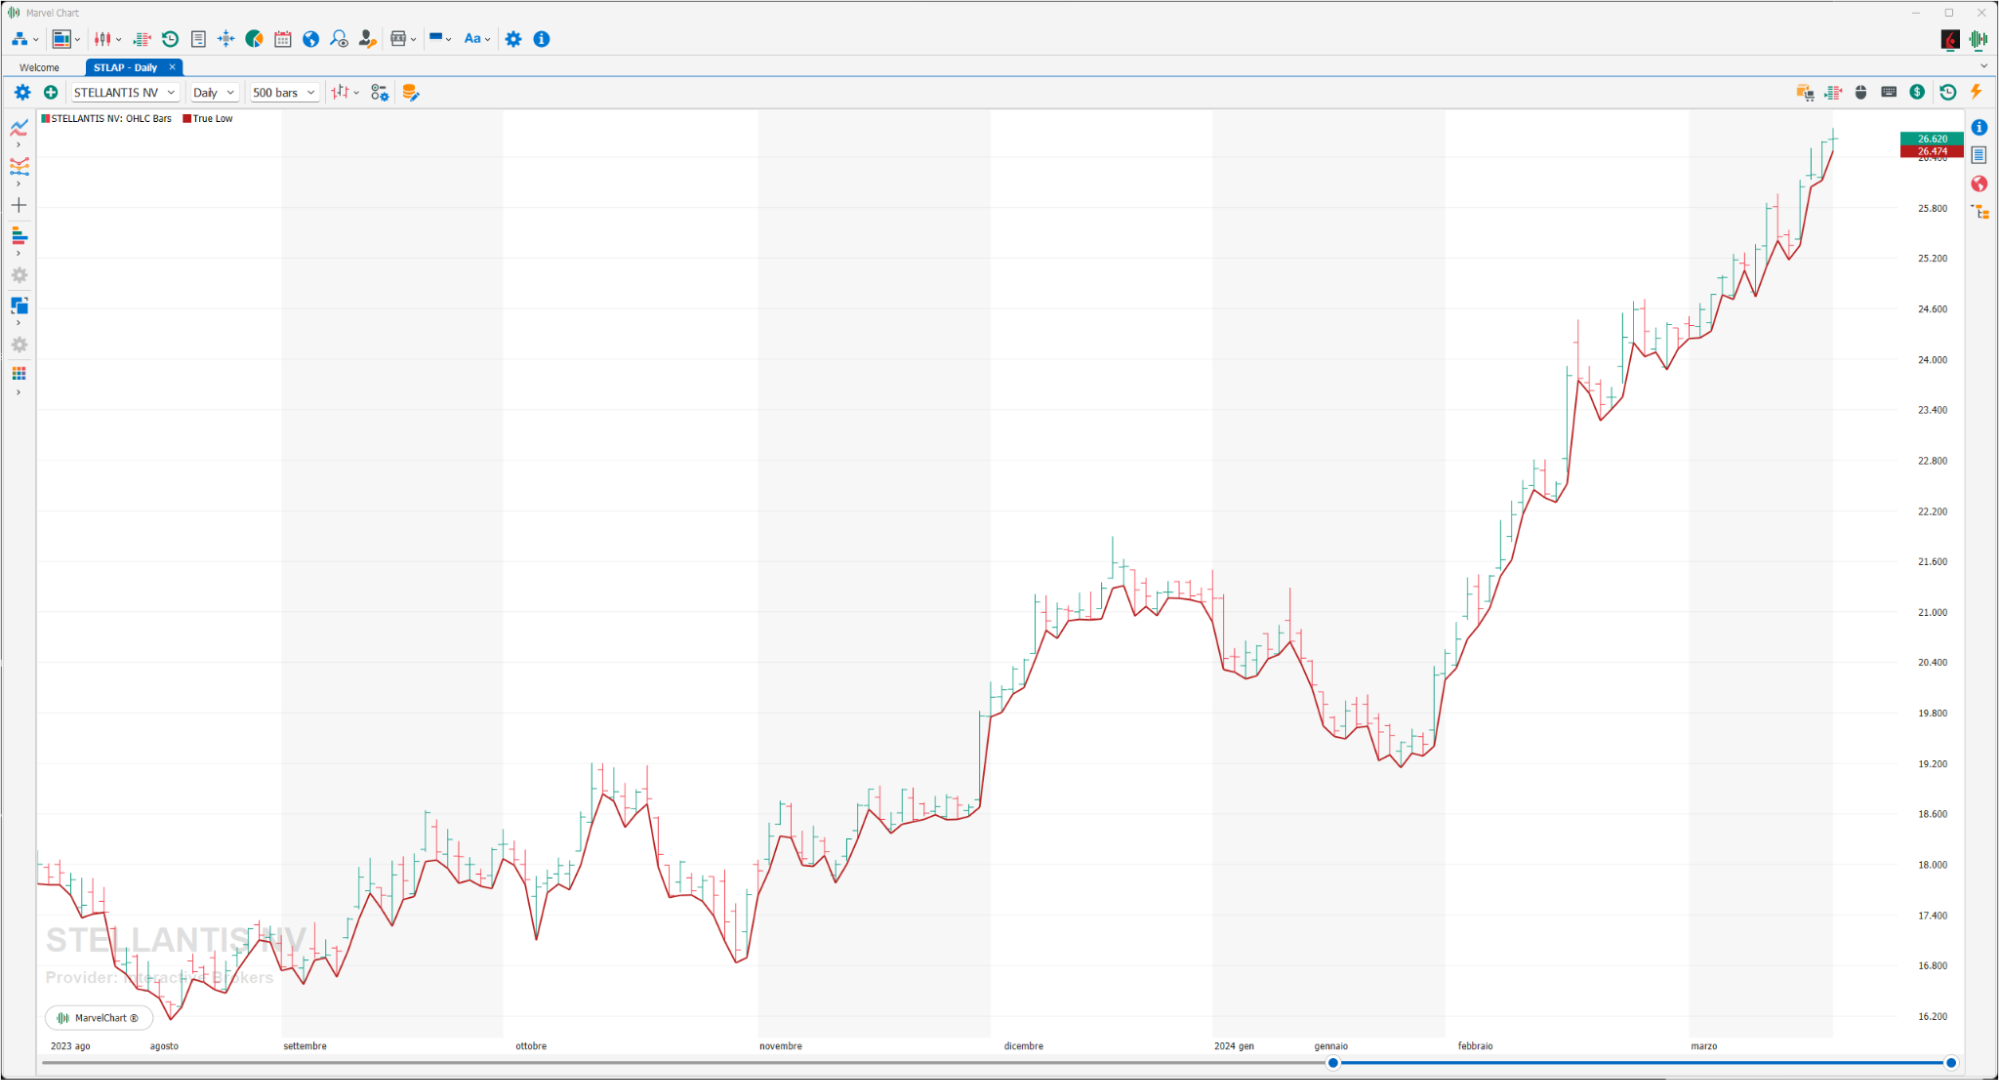
Simple indicator calculated by taking the lowest values between the LOW value of the current bar and the CLOSE of the previous one.
Typical Price (HLC3)
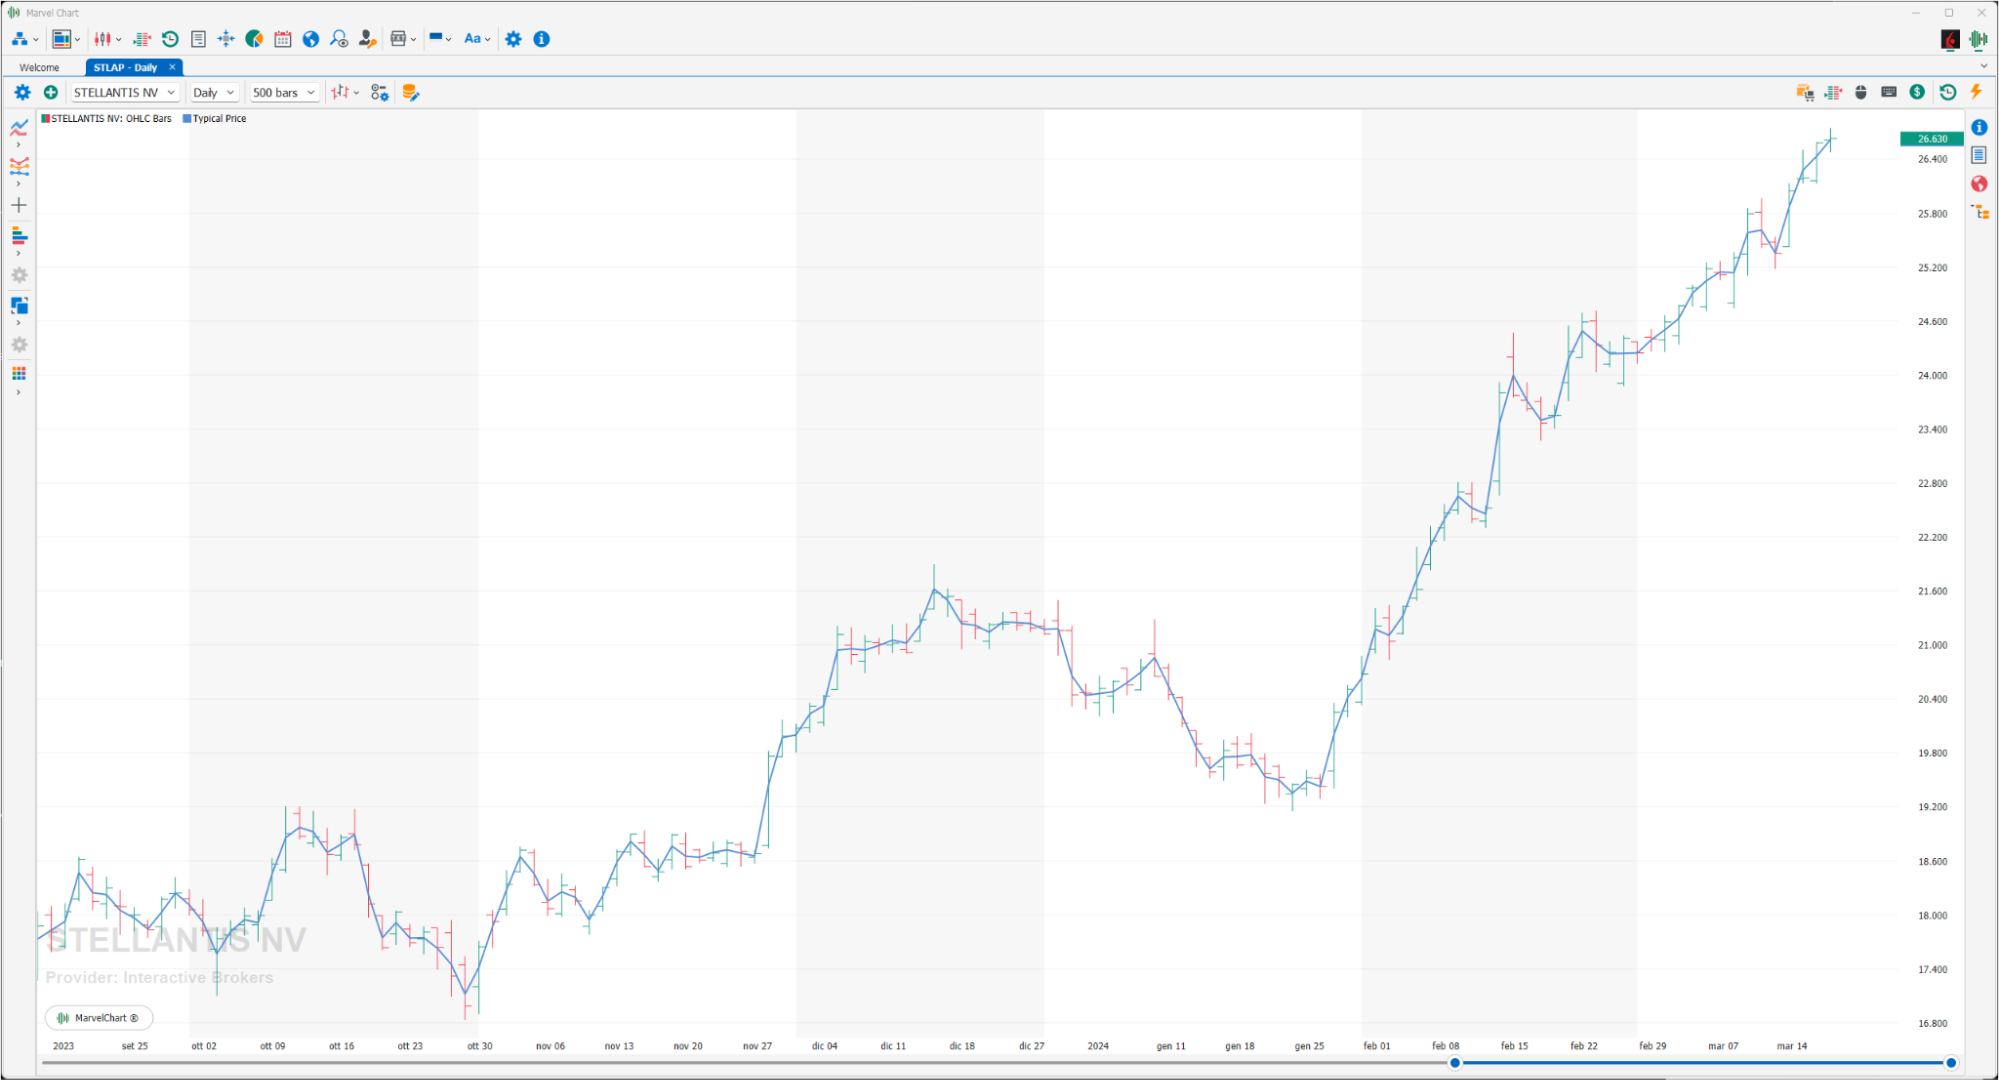
Typical Price is a commonly used indicator to calculate supports and resistances using the average of the HIGH, LOW and CLOSE of the previous bar.
Weighted Close (HLCC4)
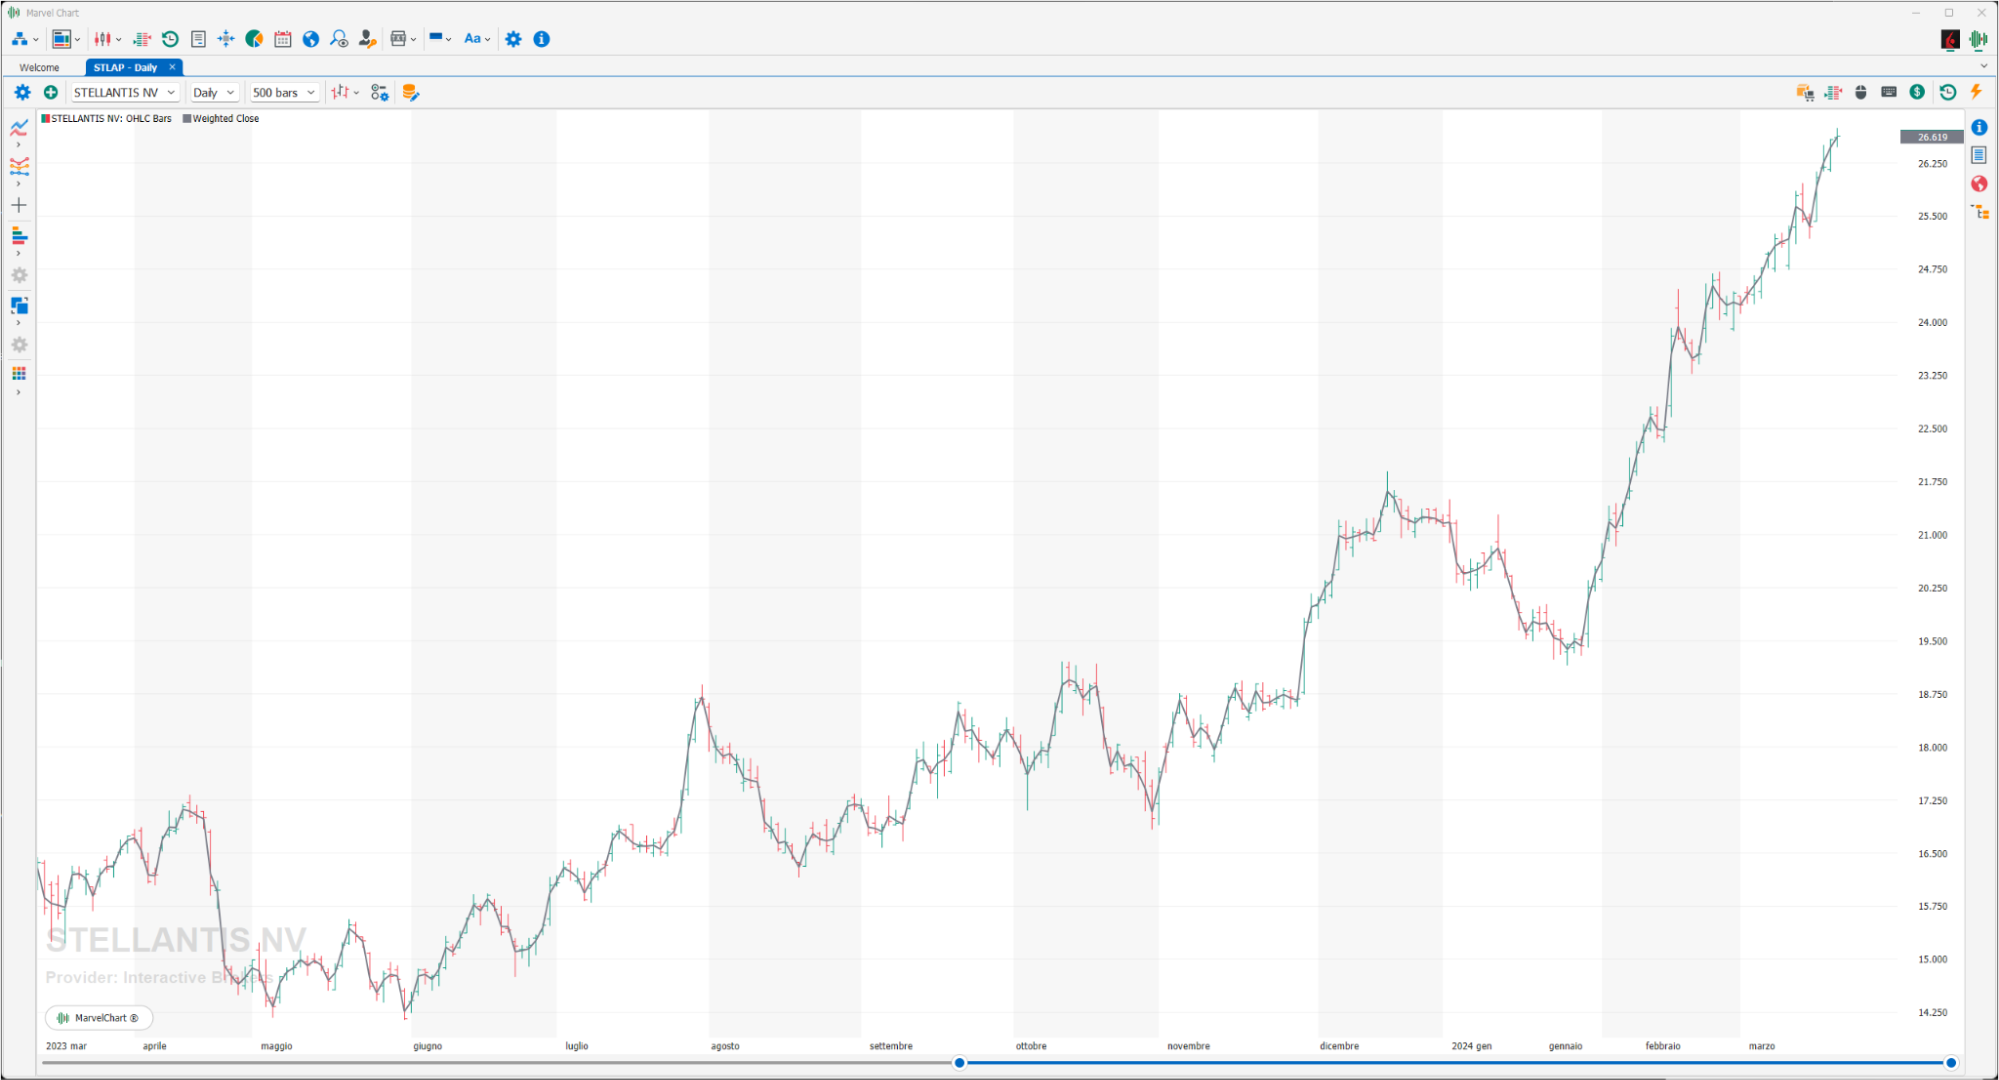
The Weighted Close indicator is constructed as a weighted average of the bar prices. In this indicator gives double weight to the CLOSE price compared to the sum of the HIGH and LOW of the bar. Indicators very similar to this are the Median Price and the Typical Price. We have a BUY signal when the indicator crosses an Exponential Moving Average from bottom to top. up, vice versa we have a SHORT signal when the indicator crosses an Exponential Moving Average from top to bottom. The Weighted Close indicator is very useful because it limits false entry signals generated by small oscillations.
Yesterday Close
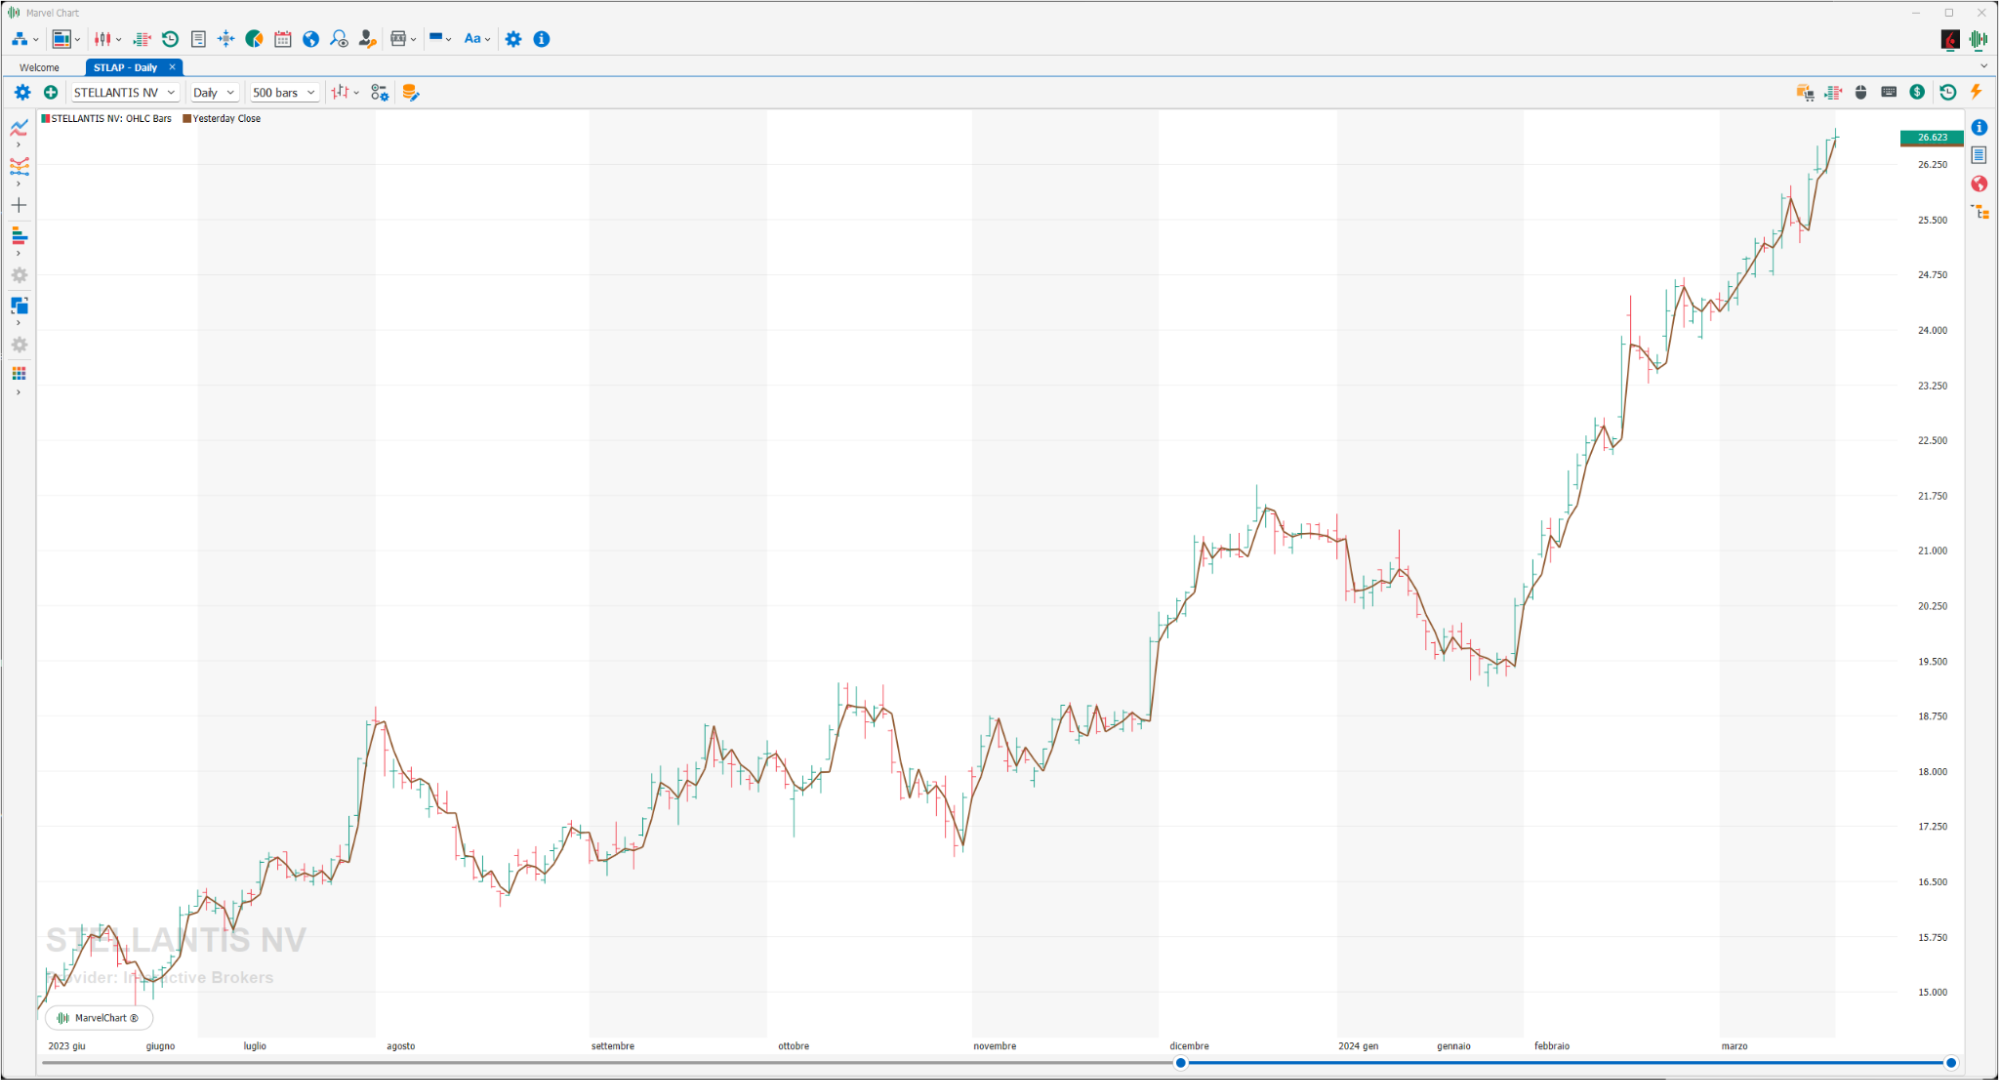
Gets the previous day's close price.
Yesterday High
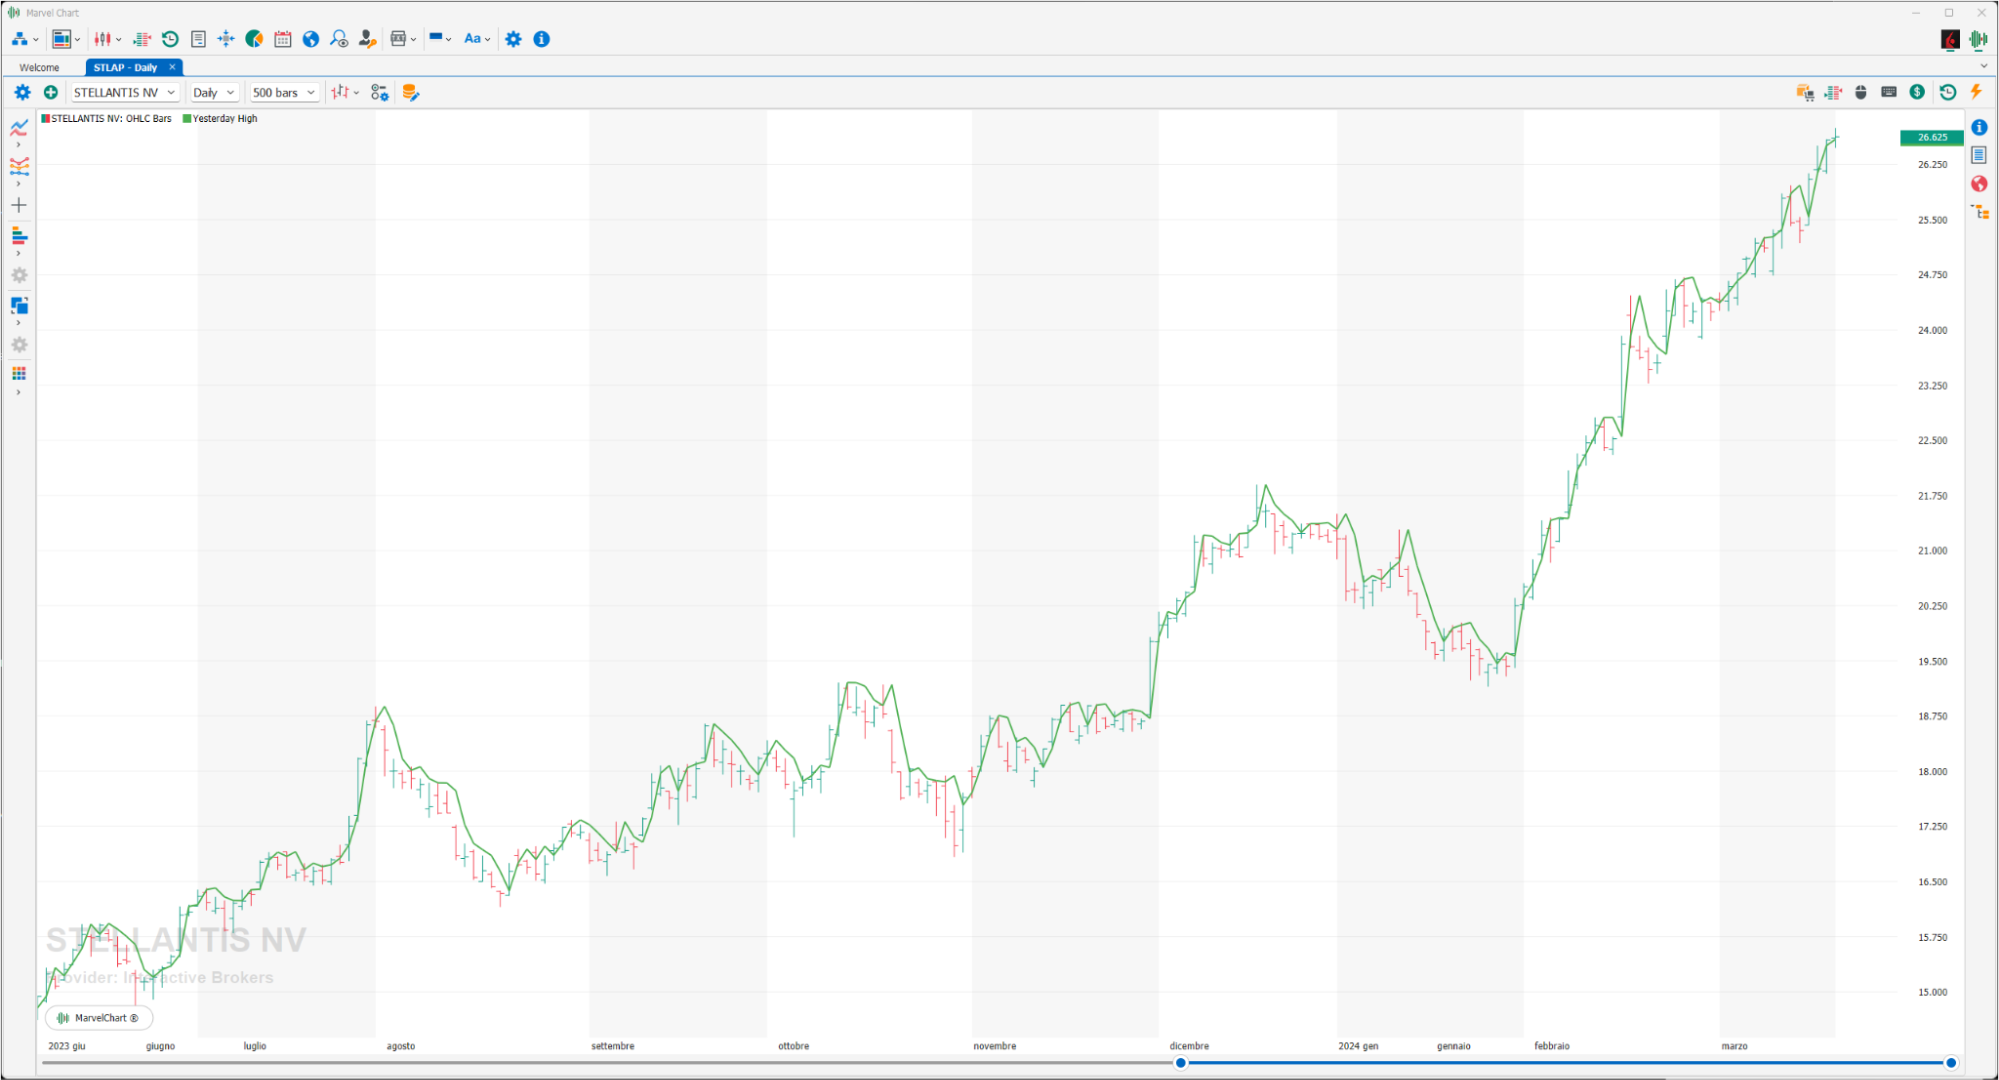
Gets the previous day's high price.
Yesterday Low
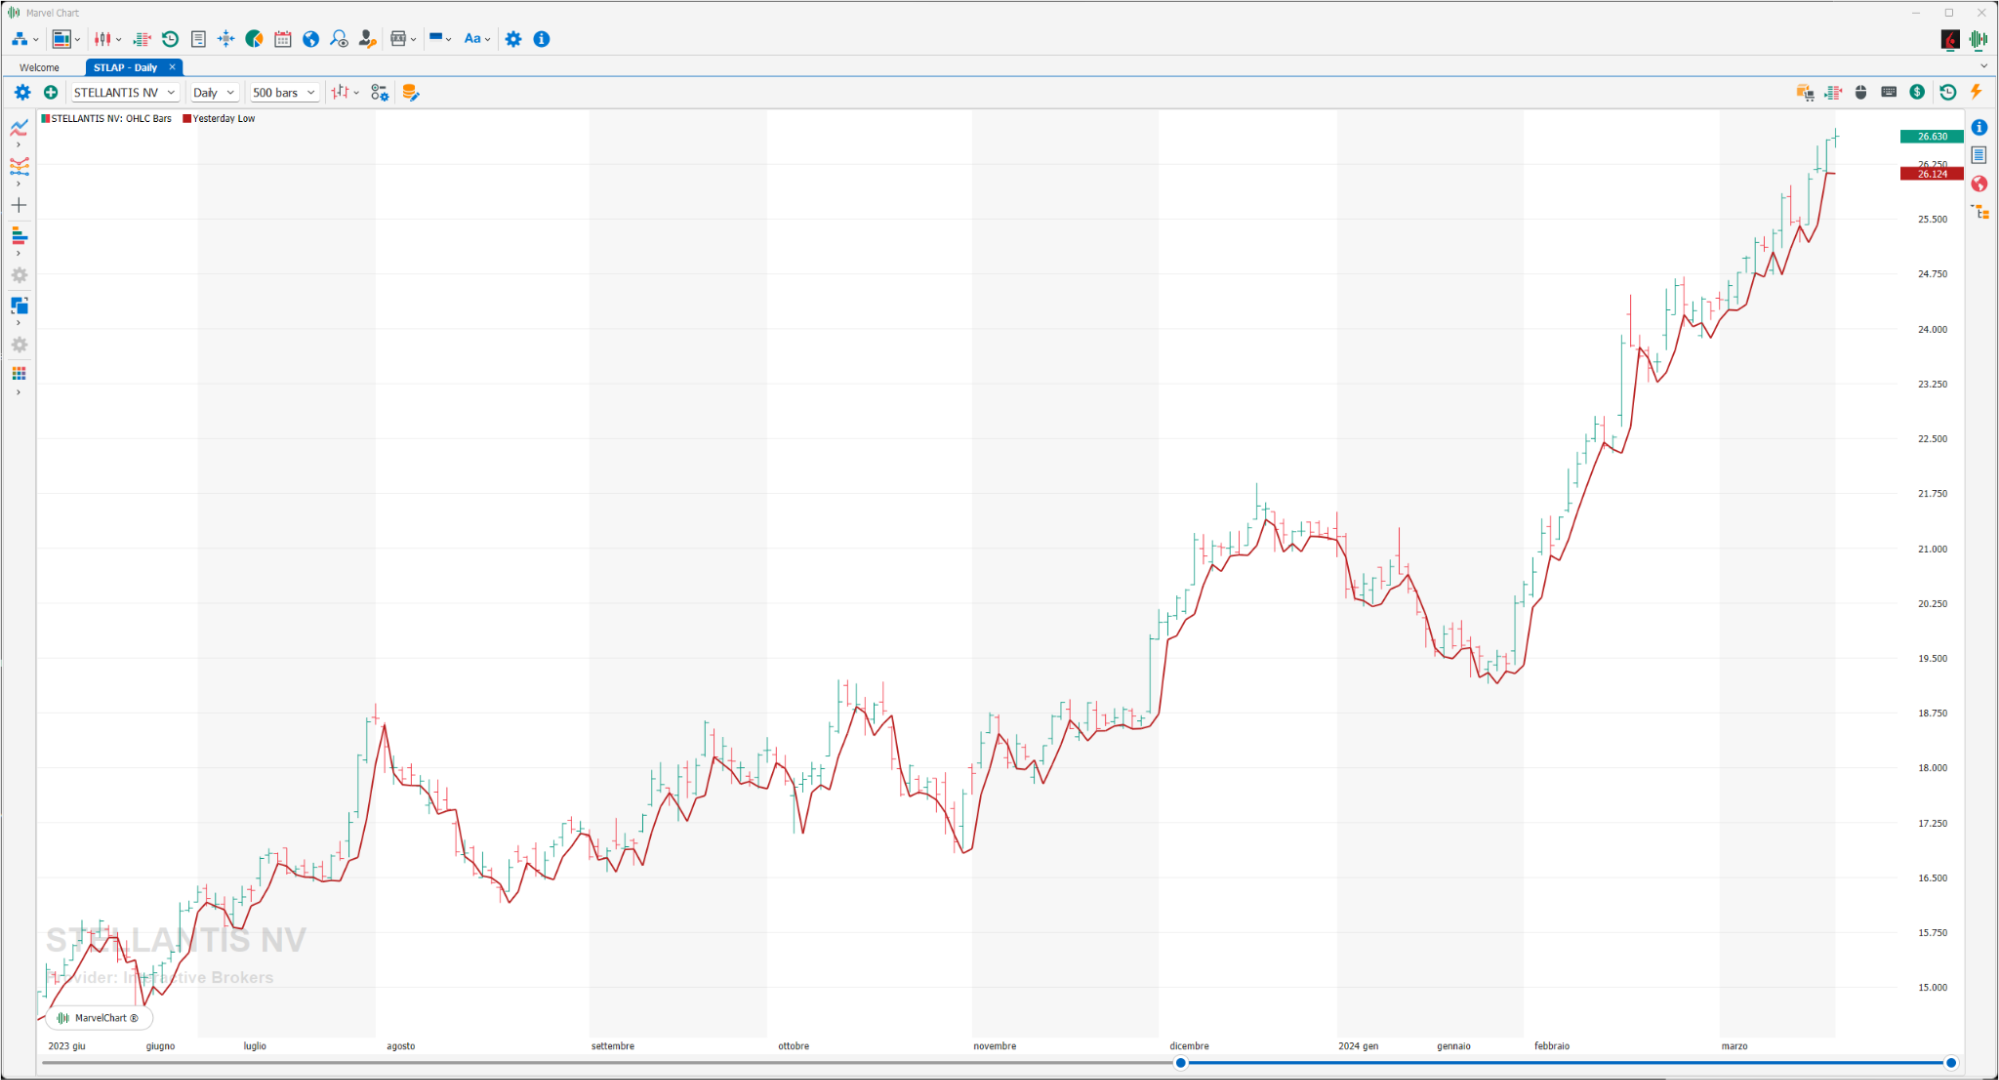
Gets the previous day's low price.
Yesterday Open
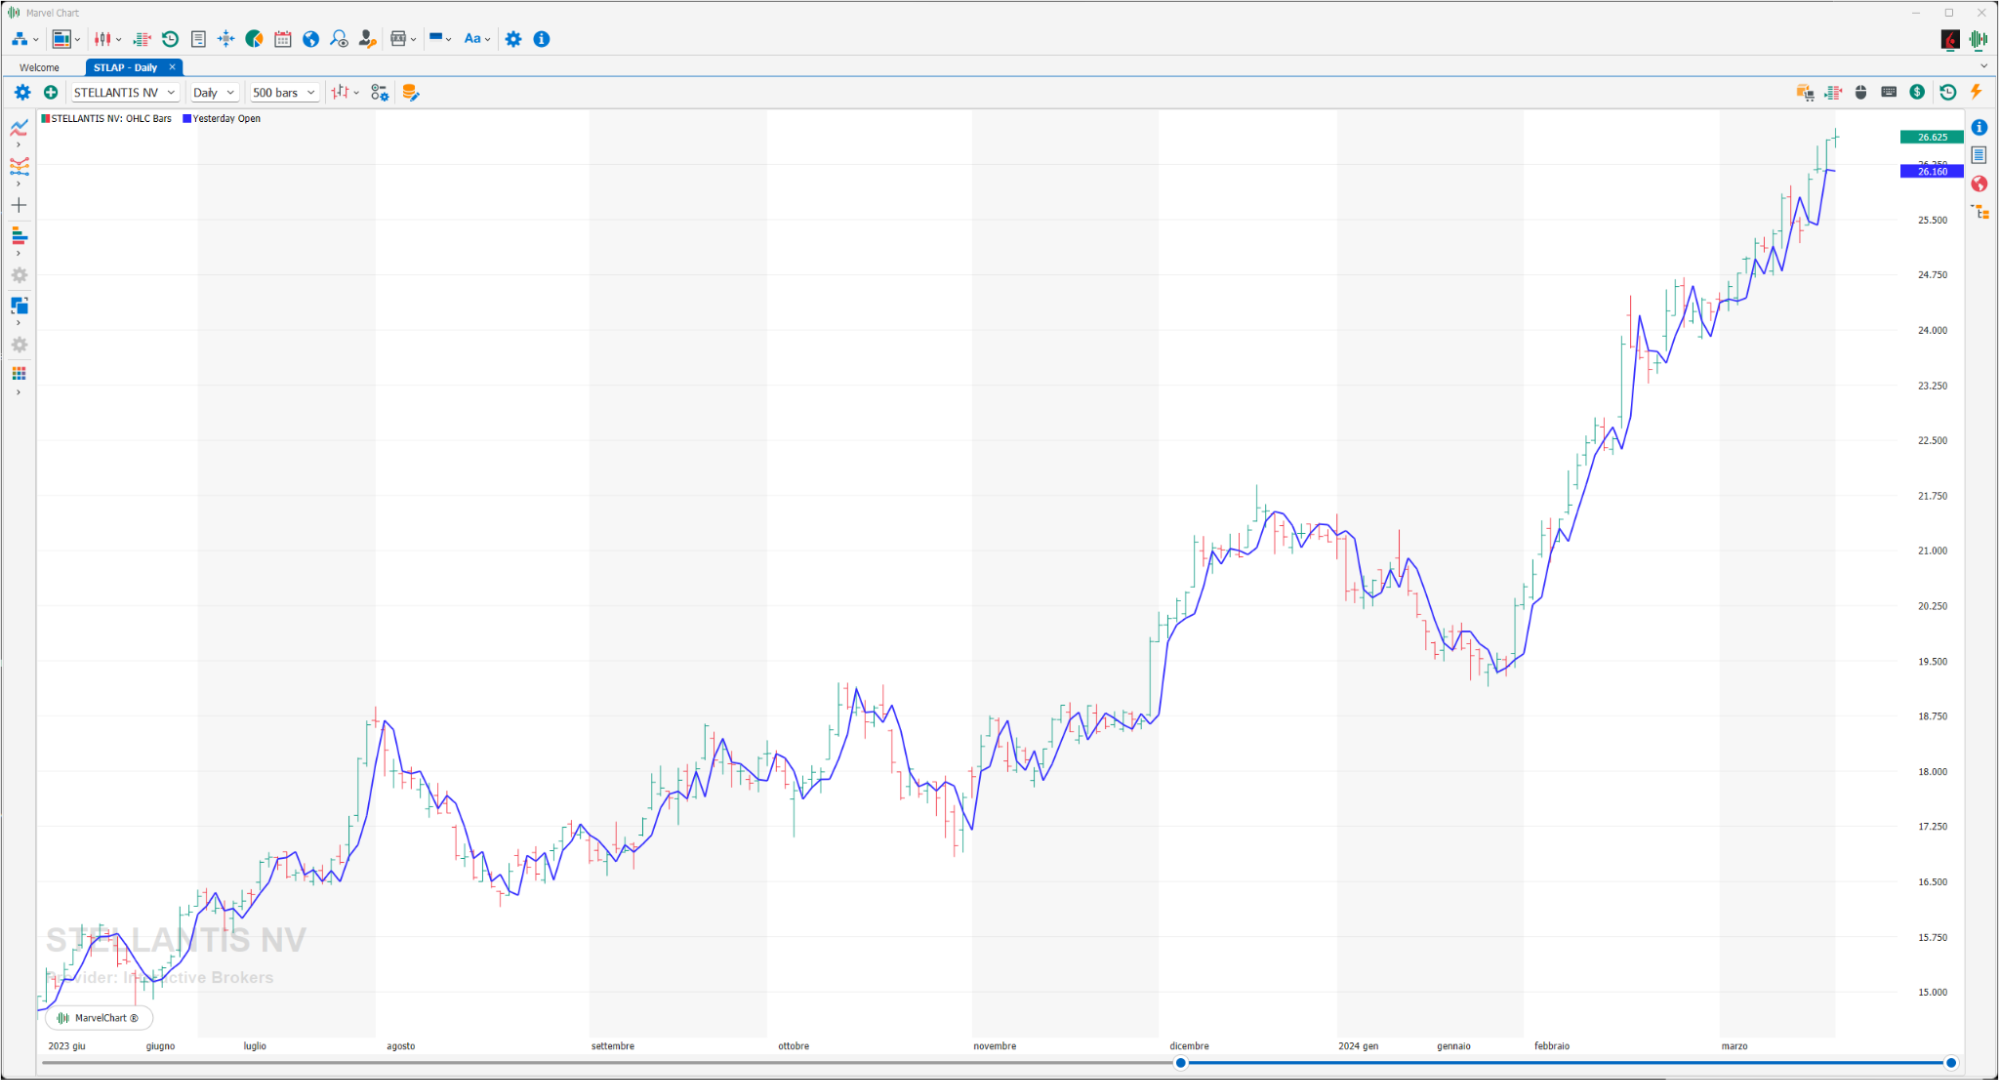
Gets the previous day's open price.