Moving Averages
Adaptive RSI Moving Average
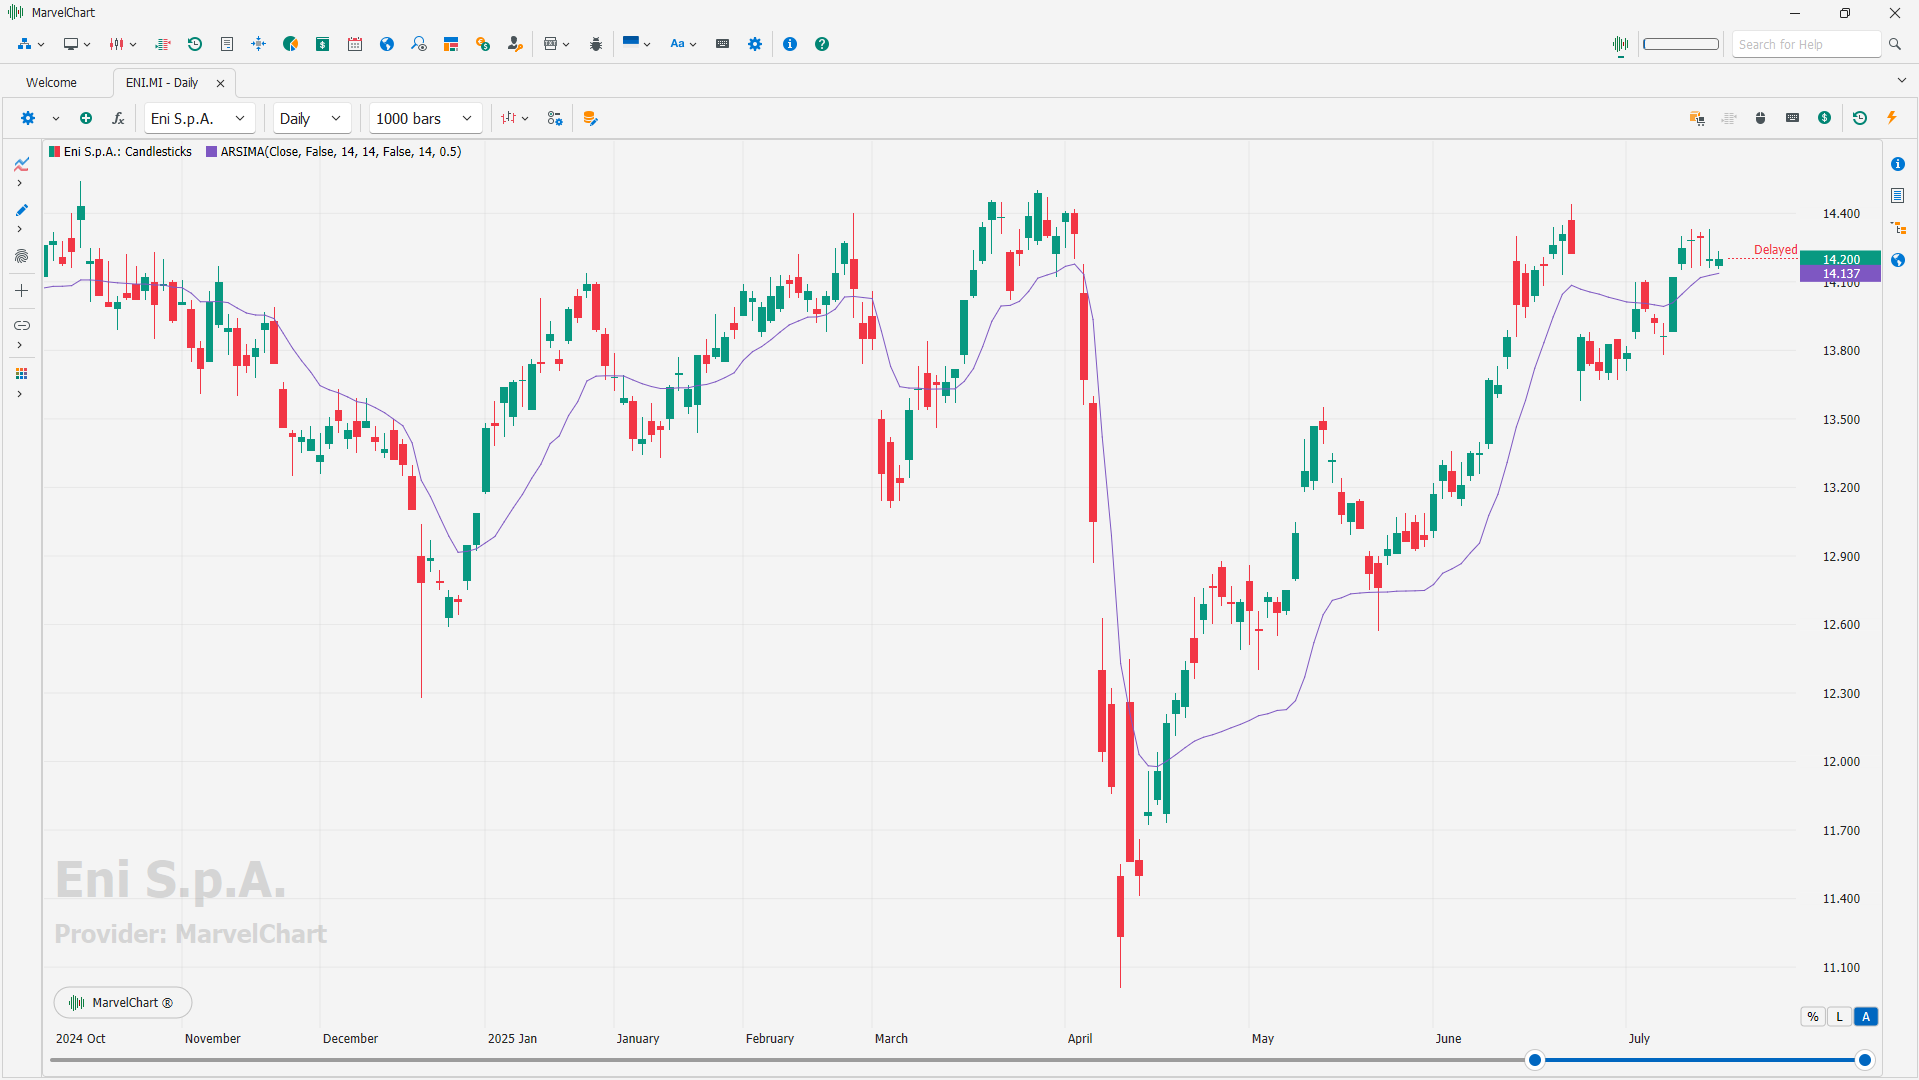
The Adaptive RSI Moving Average (ARSI) is a technical indicator that combines the principles of the Relative Strength Index (RSI) and moving averages to gauge momentum and trend direction. It dynamically adjusts its sensitivity based on market volatility, offering a more responsive oscillator than traditional moving averages or RSI. The core idea is to adapt the smoothing of the RSI based on market conditions, making it more responsive in trending markets and less susceptible to noise in choppy markets.
Key Components and Calculation
RSI Calculation
The RSI is calculated first, typically using a standard 14-period lookback. The formula is: RSI = 100 - [100 / (1 + Average Gain / Average Loss)].
Efficiency Ratio (ER)
This component measures the market's efficiency in price movement. It is calculated as: ER = |Net Change| / Sum of Absolute Price Change.
Smoothing Constant (SC)
This determines how much the moving average will be smoothed. The Adaptive RSI uses a smoothing constant that varies based on the Efficiency Ratio.
Kaufman Adaptive Moving Average (KAMA)
The KAMA is calculated using the ER and SC. It is used to smooth the RSI values. A common formula for AMA is: AMA = [ER * (Fast SC - Slow SC) + Slow SC].
Adaptive RSI
The Adaptive RSI is then calculated using the AMA applied to the RSI values. This provides a smoothed RSI that adapts to market conditions.
Interpretation and Usage
Trend Identification
The Adaptive RSI, like the standard RSI, can be used to identify overbought and oversold conditions. However, the Adaptive RSI's dynamic nature provides a more nuanced view of momentum.
Signal Generation
The Adaptive RSI can be used to generate trading signals by identifying crossovers with its own moving average (signal line) or by observing its position relative to overbought/oversold levels.
Volatility Adaptation
The Adaptive RSI's ability to adjust its smoothing based on volatility helps traders filter out false signals in choppy markets and respond more quickly to trends.
Example
A trader might use the Adaptive RSI to identify a bullish trend when the Adaptive RSI crosses above its signal line and moves above the overbought level. Conversely, a bearish trend might be identified when the Adaptive RSI crosses below its signal line and moves below the oversold level.
In essence, the Adaptive RSI provides a more dynamic and responsive measure of market momentum than traditional RSI and moving averages, making it a valuable tool for traders seeking to identify and capitalize on trends.
Arnaud Legoux Moving Average
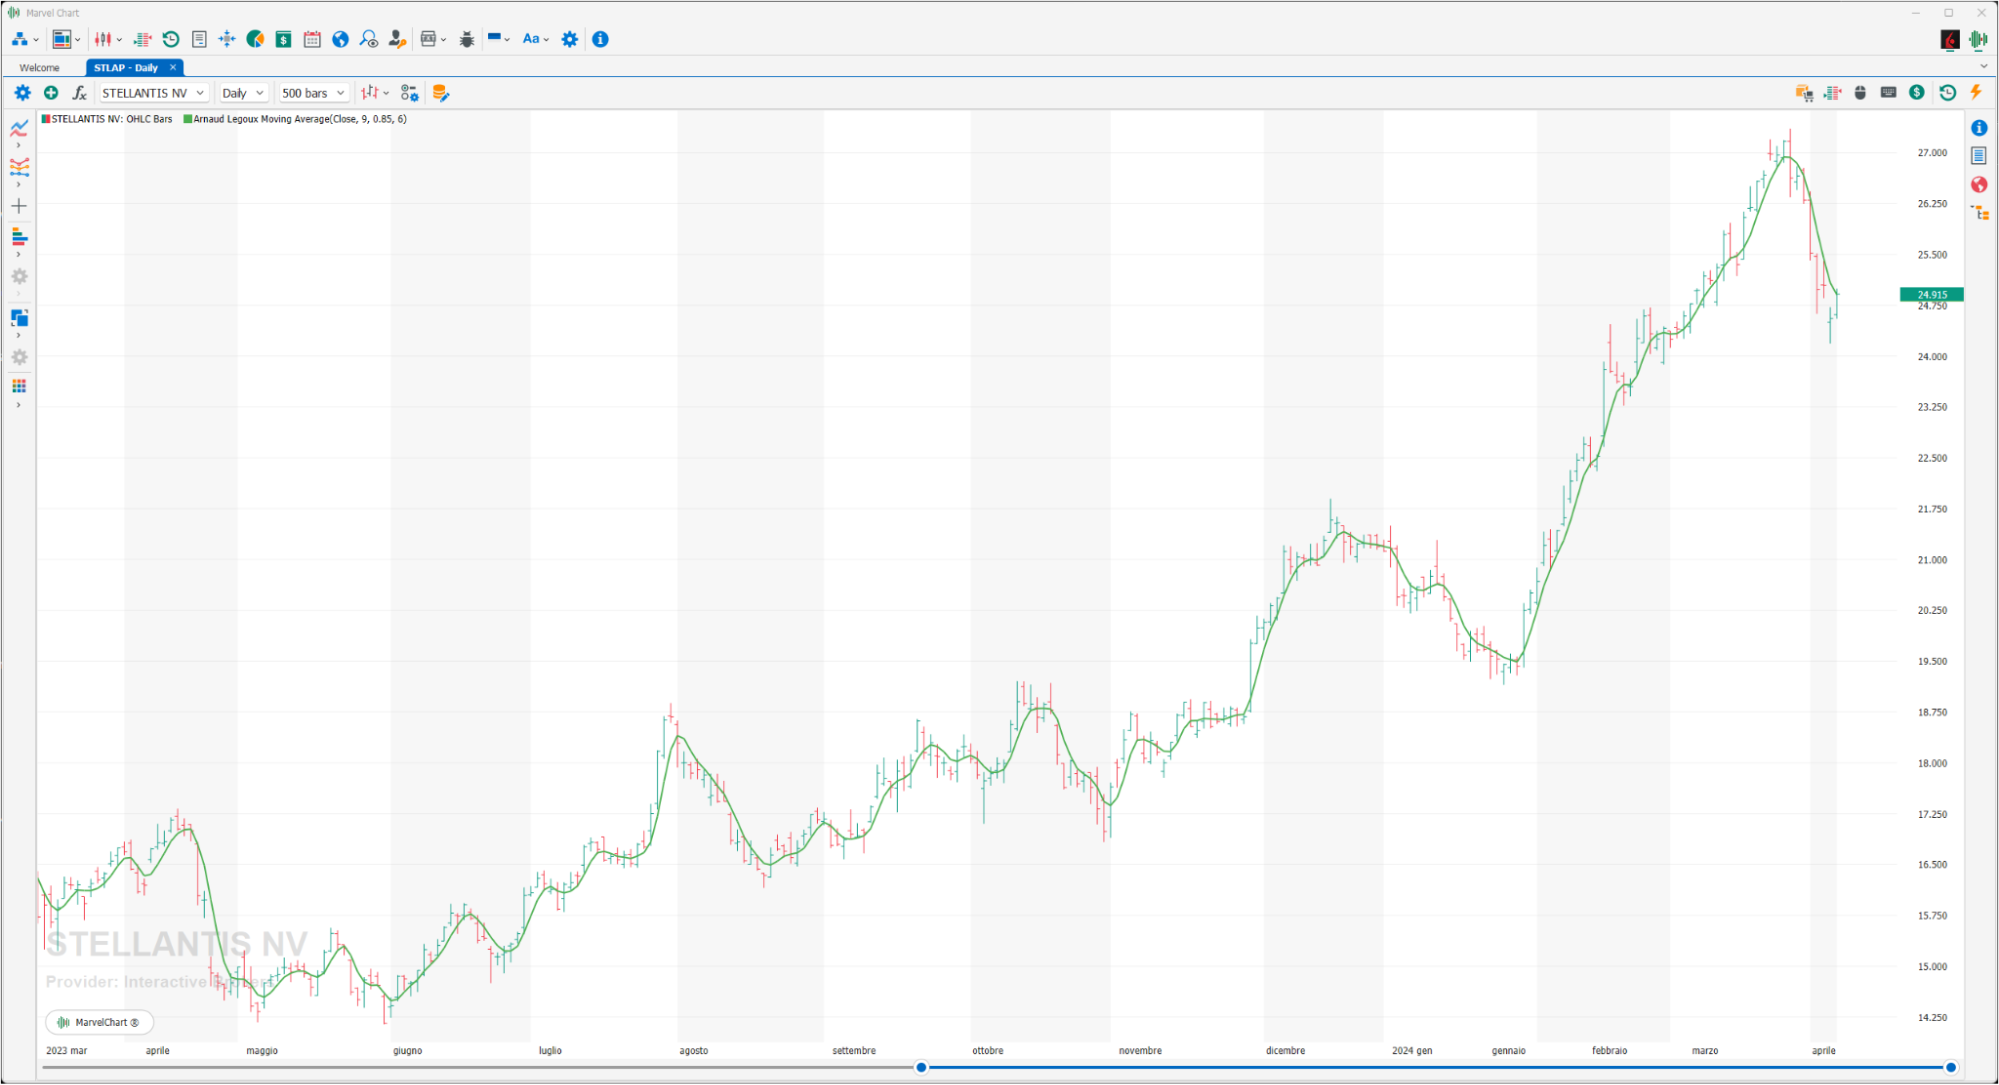
The Arnaud Legoux Moving Average (ALMA) is different from other moving averages because of its specific design that uses the Gaussian distribution that is shifted with a calculated offset so that the average is biased towards the most recent days, rather than centered on the time frame. Based on the Generalized Moving Average Framework, ALMA is able to use various indicators in conjunction with its capabilities and work on multiple time frames, with the inclusion of custom bar types.
DEMA
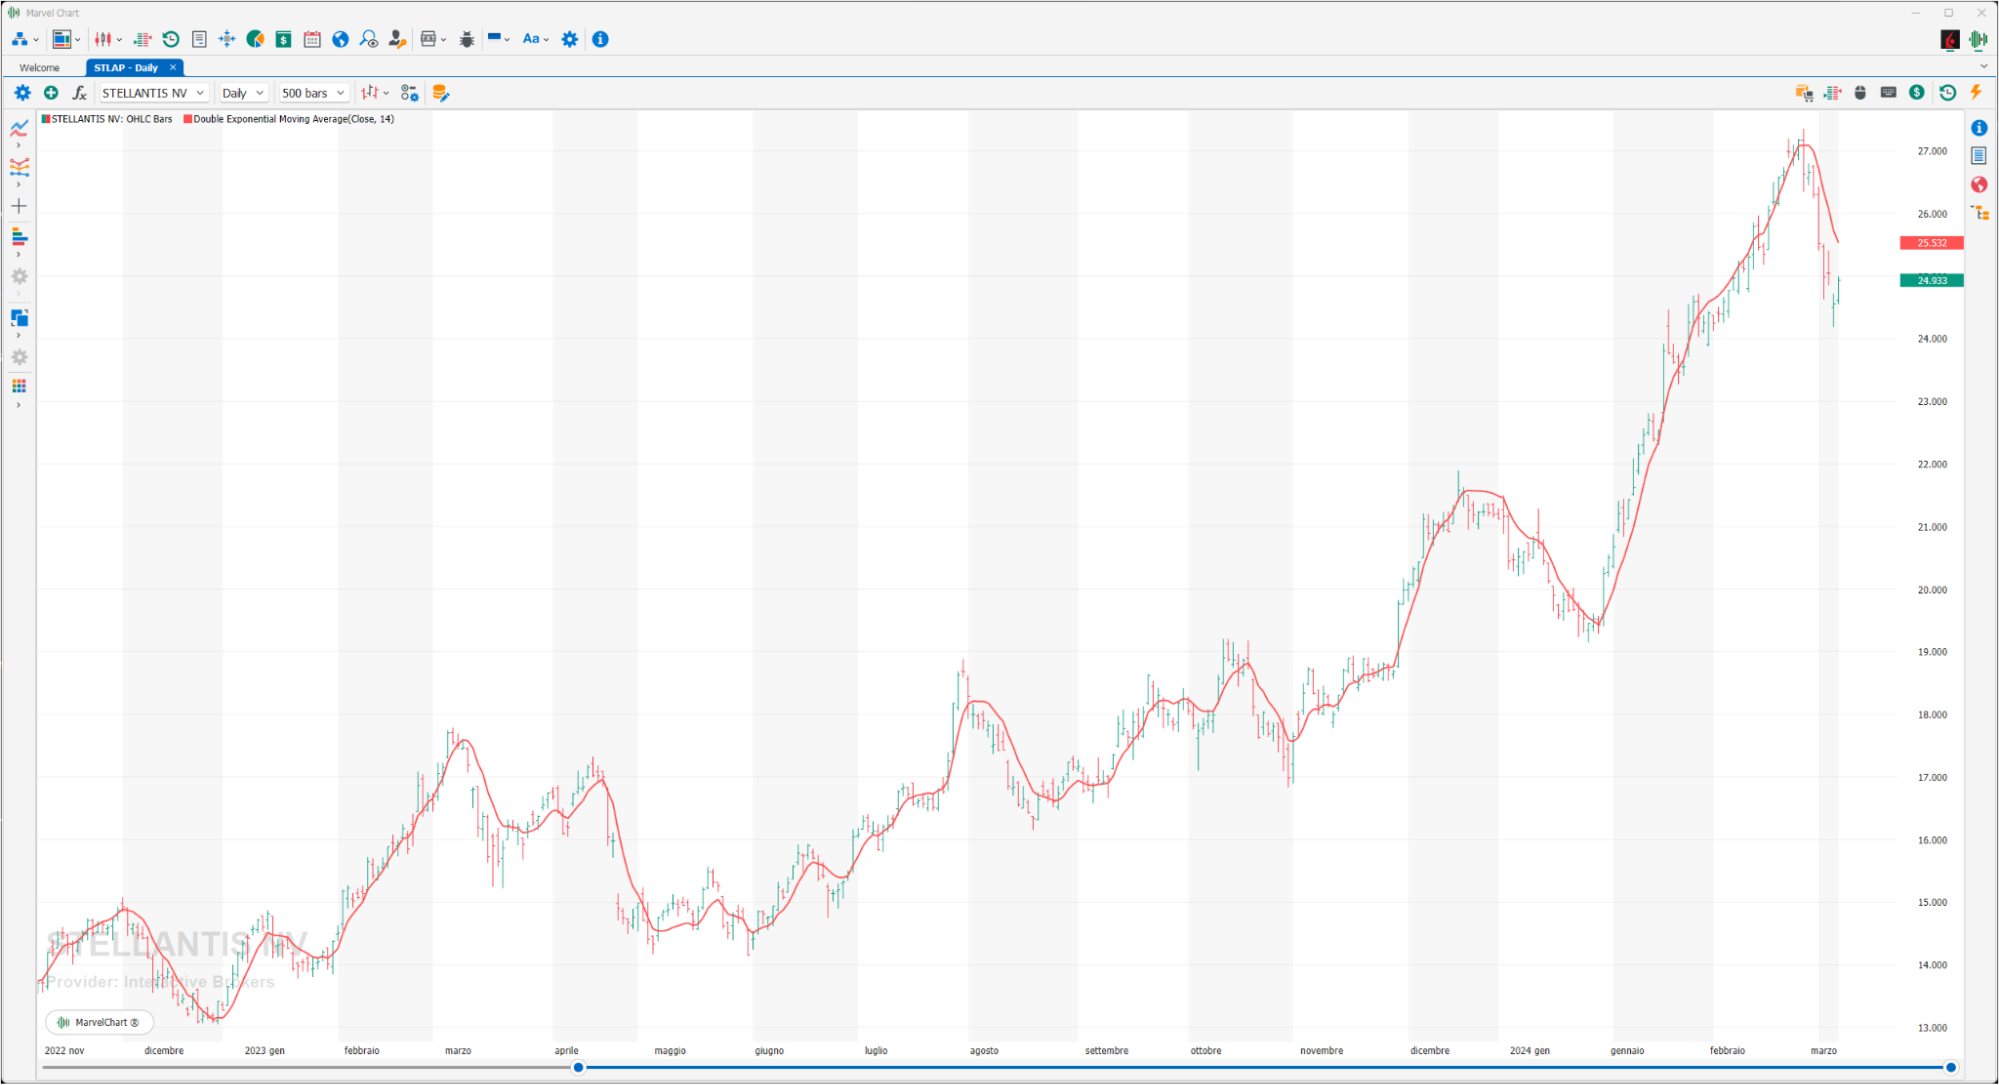
The Double Exponential Moving Average (DEMA) is a technical analysis indicator designed to reduce the lag in the results produced by a traditional moving average. Technical traders use it to reduce the amount of "noise" that can distort the movements on a price chart. Like any moving average, the DEMA is used to indicate the price movement of a stock or other asset. By monitoring its price over time, a trader can identify an uptrend, when the price moves above its average, or a downtrend, when the price moves below its average. When the price moves above the average, it could signal a lasting change in the trend. As the name suggests, the DEMA uses two exponential moving averages (EMAs) to eliminate the lag in the charts.
Exponential Moving Average
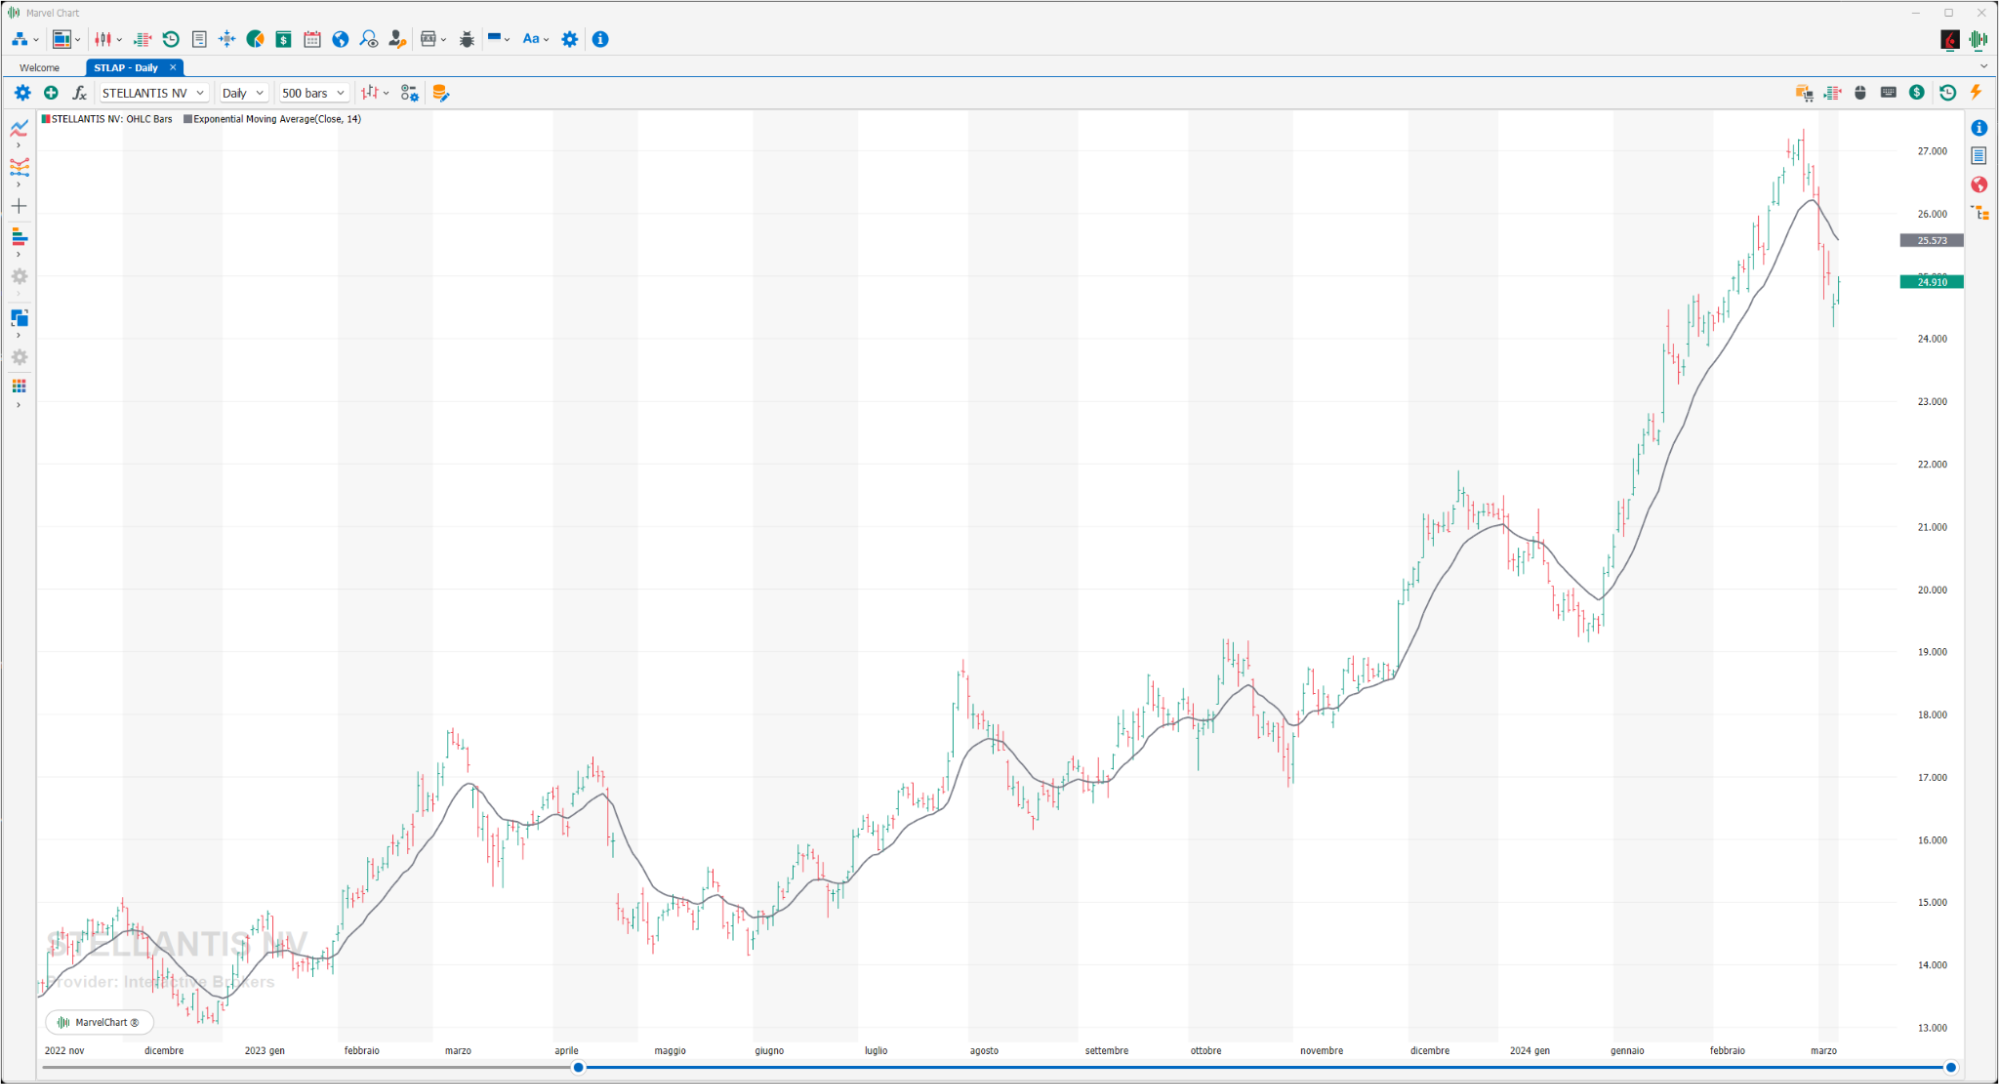
This moving average is generated by a much more complex calculation system that always tries to eliminate the defects of the simple moving average. A different weight is therefore given to the various prices, greater to the most recent ones and less to the oldest ones, in this way we try to solve the problem of the reactivity of a moving average by introducing a system capable of assigning a proportionally higher value to the most recent data, assuming that the latter are the most significant and representative of the real evolution of prices. The result is a moving average that, for the same time domain, is more reactive than a simple moving average of the same length.
Hull Moving Average
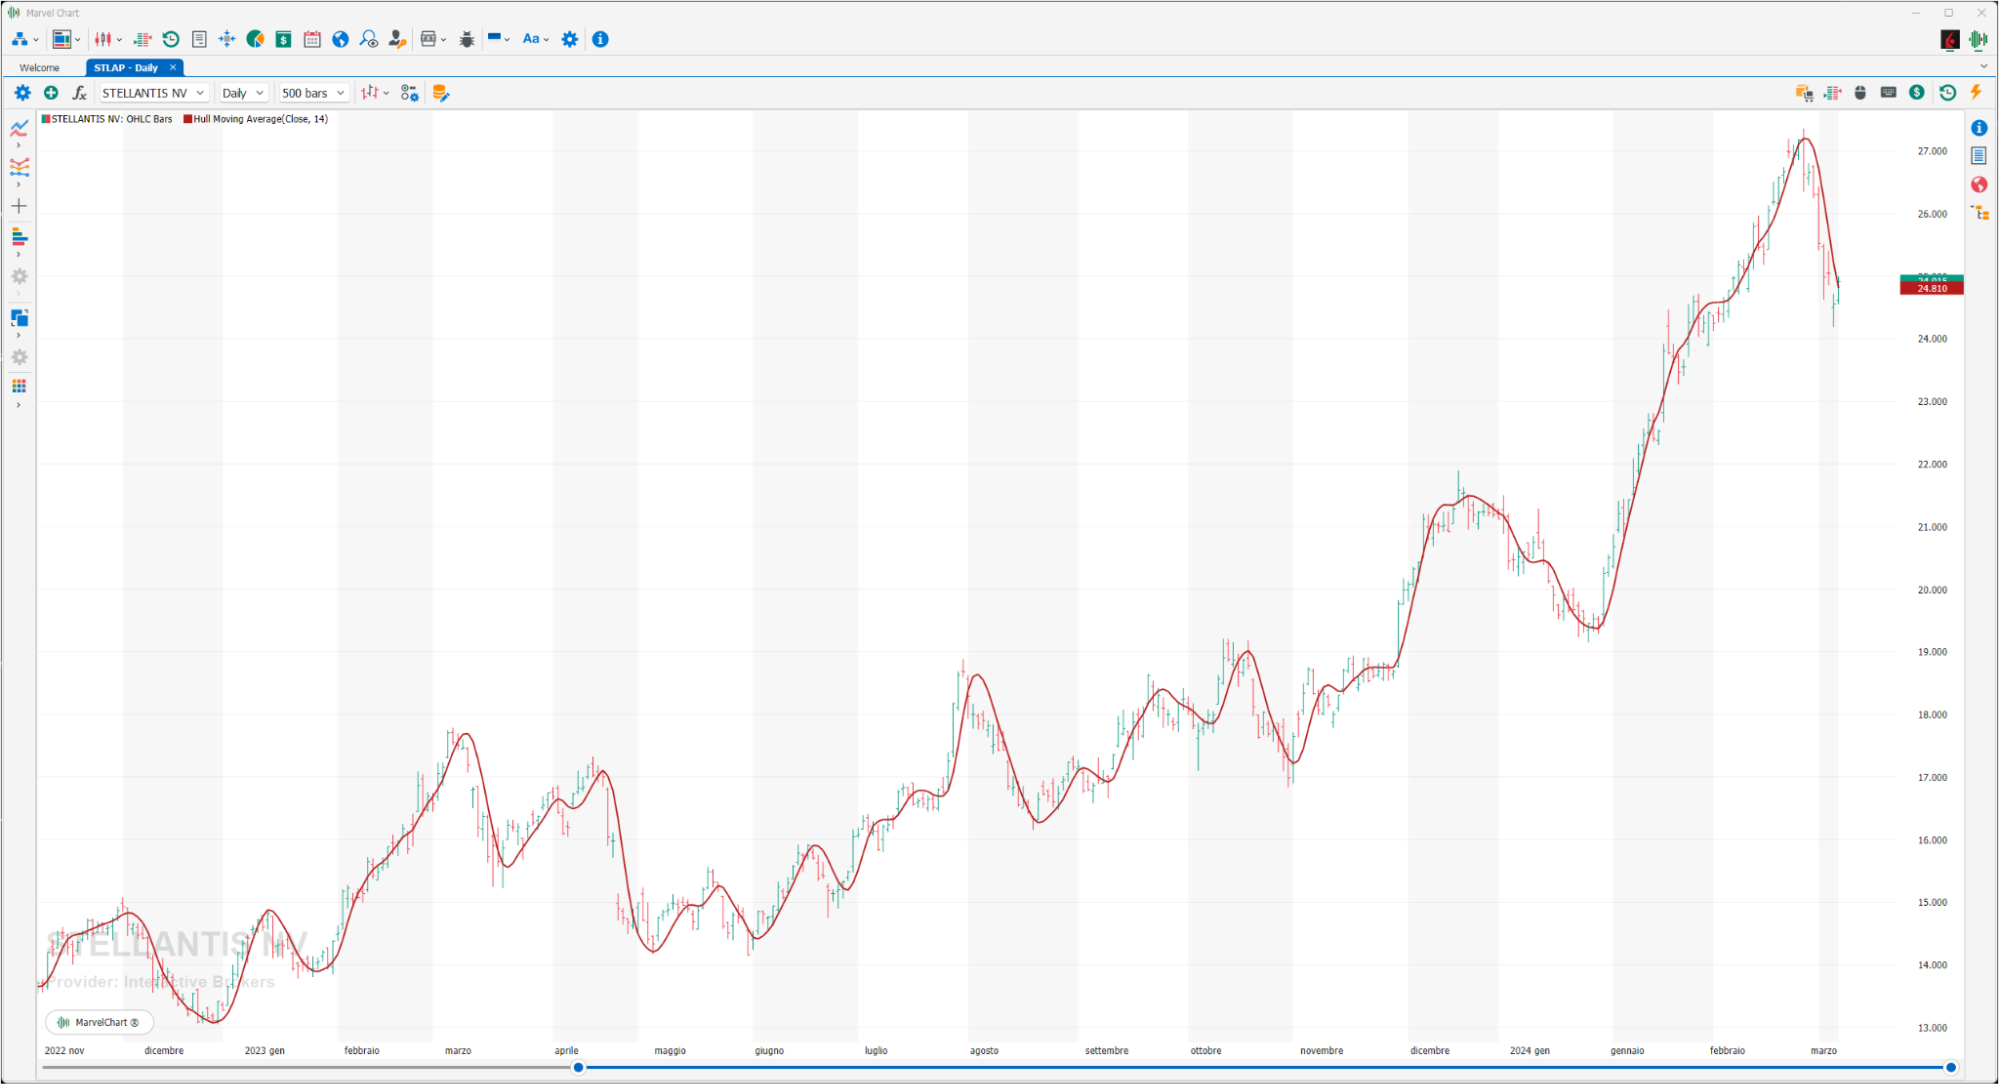
The Hull Moving Average attempts to minimize the lag of a traditional moving average while maintaining the smoothness of the moving average line. Developed by Alan Hull in 2005, this indicator uses weighted moving averages to prioritize the most recent values and significantly reduce the lag. The resulting average is more responsive and suitable for identifying entry points.
Kaufman Adaptive Moving Average
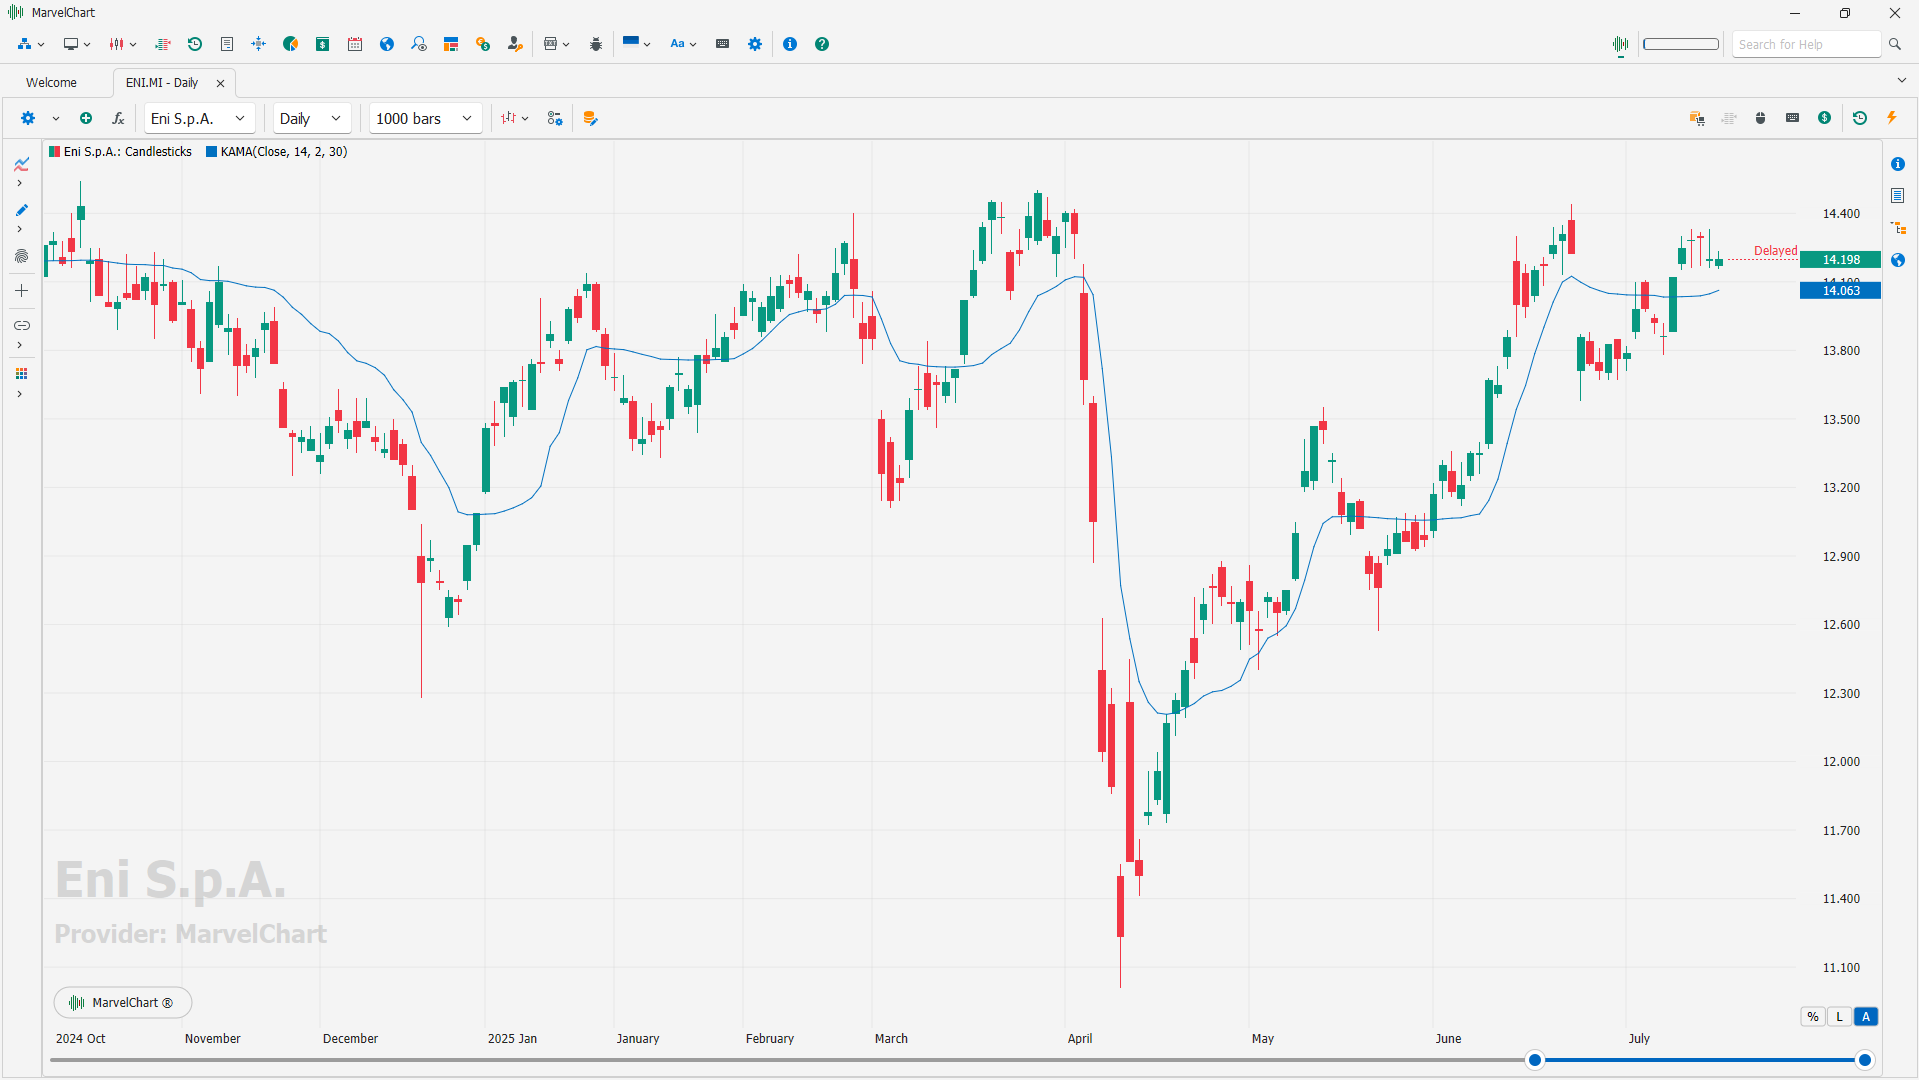
Developed by Perry Kaufman, Kaufman's Adaptive Moving Average (KAMA) is a moving average designed to account for market noise or volatility. KAMA will closely follow prices when the price swings are relatively small, and the noise is low. KAMA will adjust when the price swings widen and follow prices from a greater distance. This trend-following indicator can identify the overall trend, time turning points and filter price movements.
Moving Average Envelope
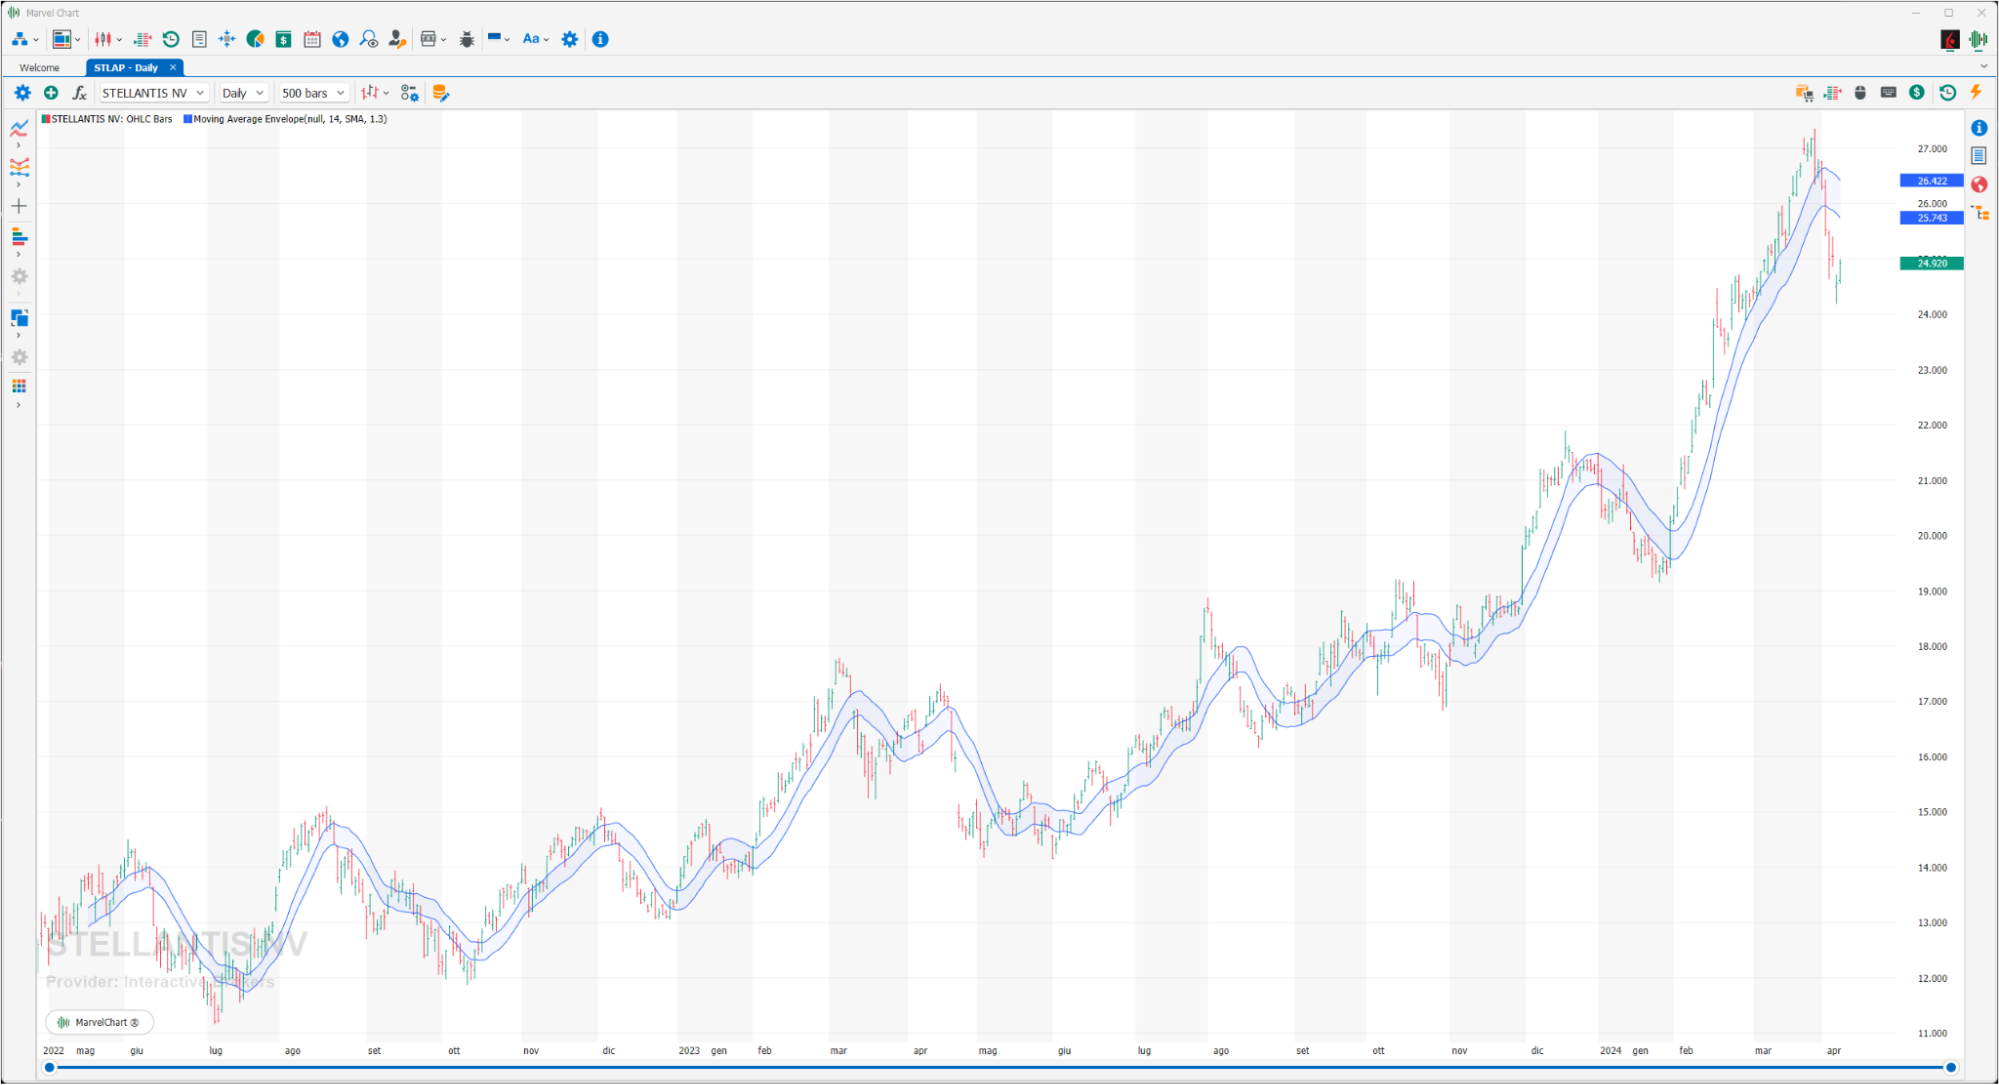
These are two moving averages plotted simultaneously on the chart, one upper and one lower. The section between the moving averages defines the upper and lower limits of the trading range of an asset. When the financial instrument reaches the upper band, a sell signal is generated, while a buy signal is generated when the lower band is reached. The optimal percentage changes based on the volatility of the financial instrument: the higher the volatility, the higher the percentage. This indicator can be calculated on any moving average, then corrected in a % of your choice.
Reciprocate Exponential Moving Average
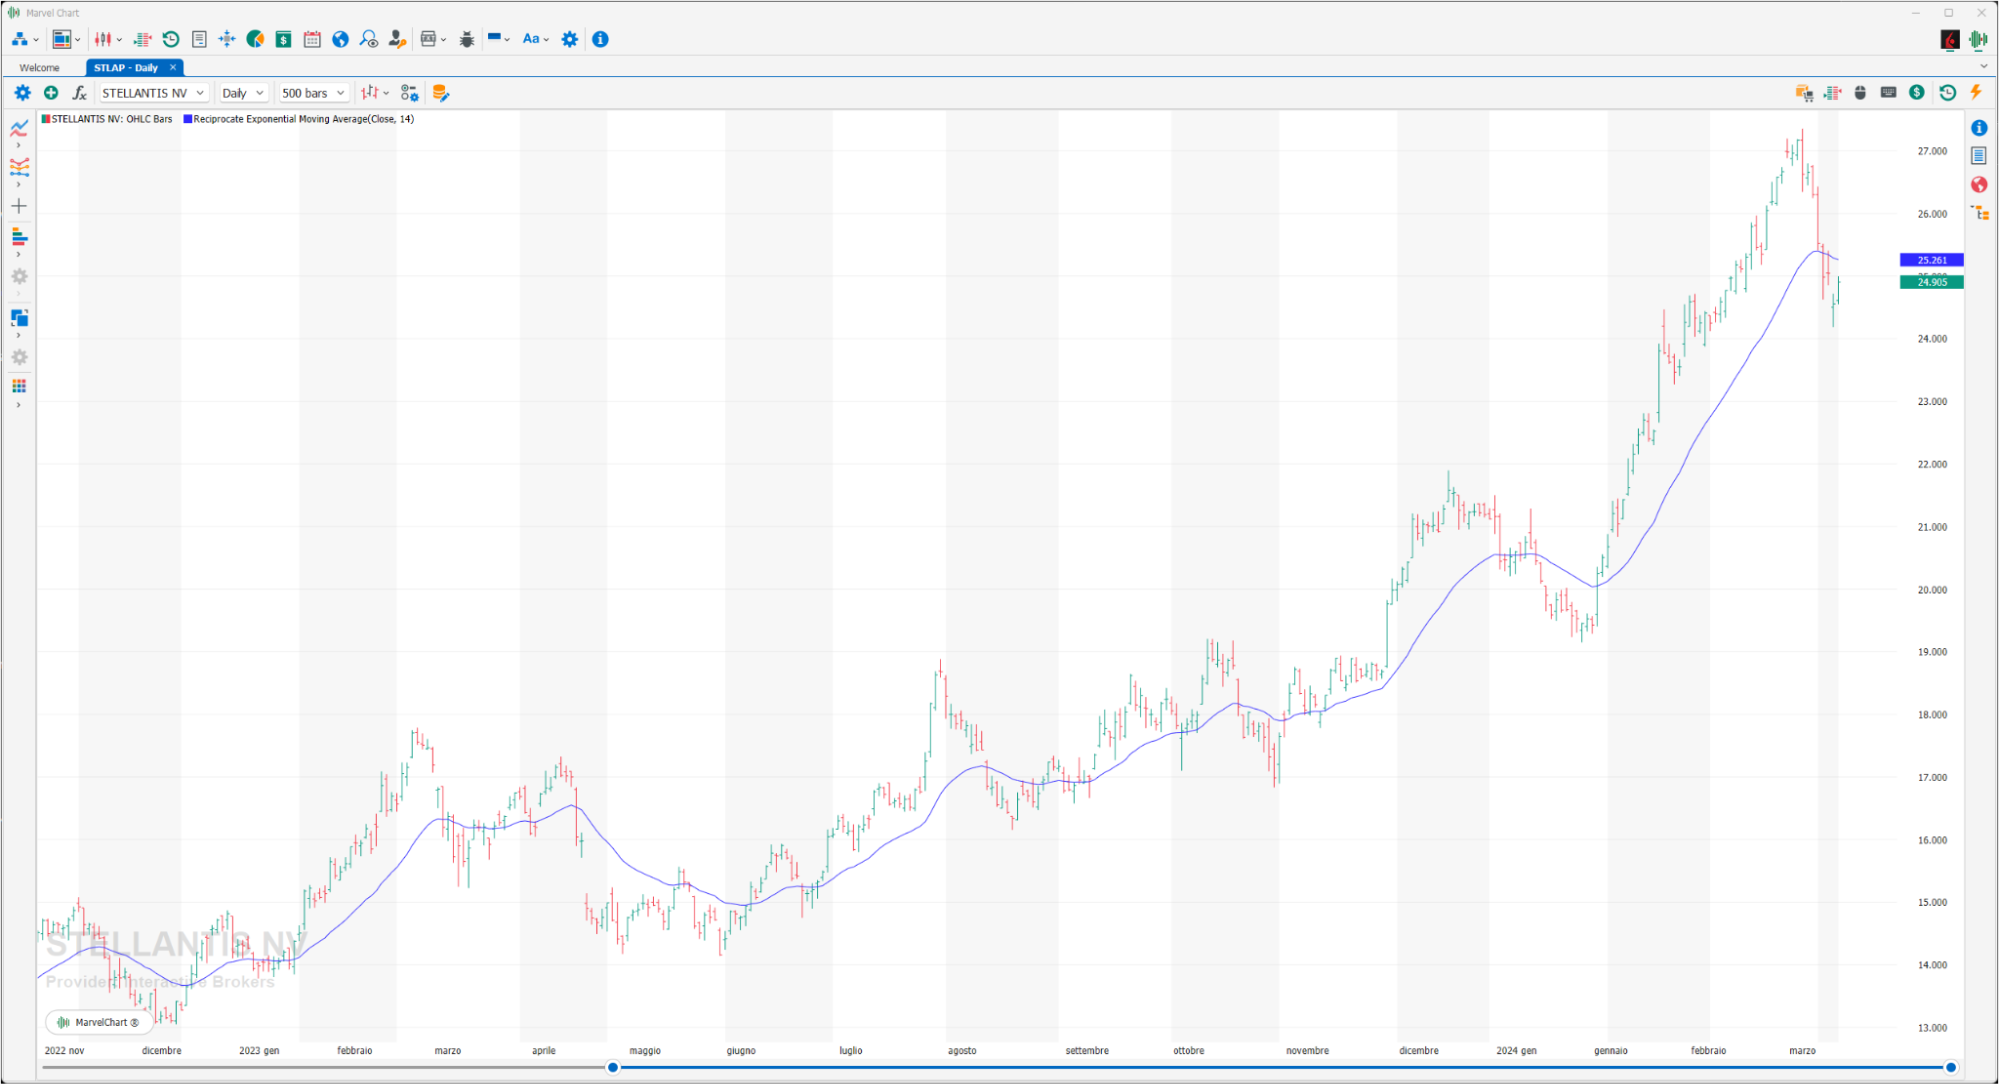
This moving average is generated by a much more complex calculation system that always tries to eliminate the defects of the simple moving average. A different weight is therefore given to the various prices, greater to the most recent ones and less to the oldest ones, in this way we try to solve the problem of the reactivity of a moving average by introducing a system capable of assigning a proportionally higher value to the most recent data, assuming that the latter are the most significant and representative of the real evolution of prices. The result is a moving average that, for the same time frame, is more reactive than a simple moving average of the same length.
Simple Moving Average
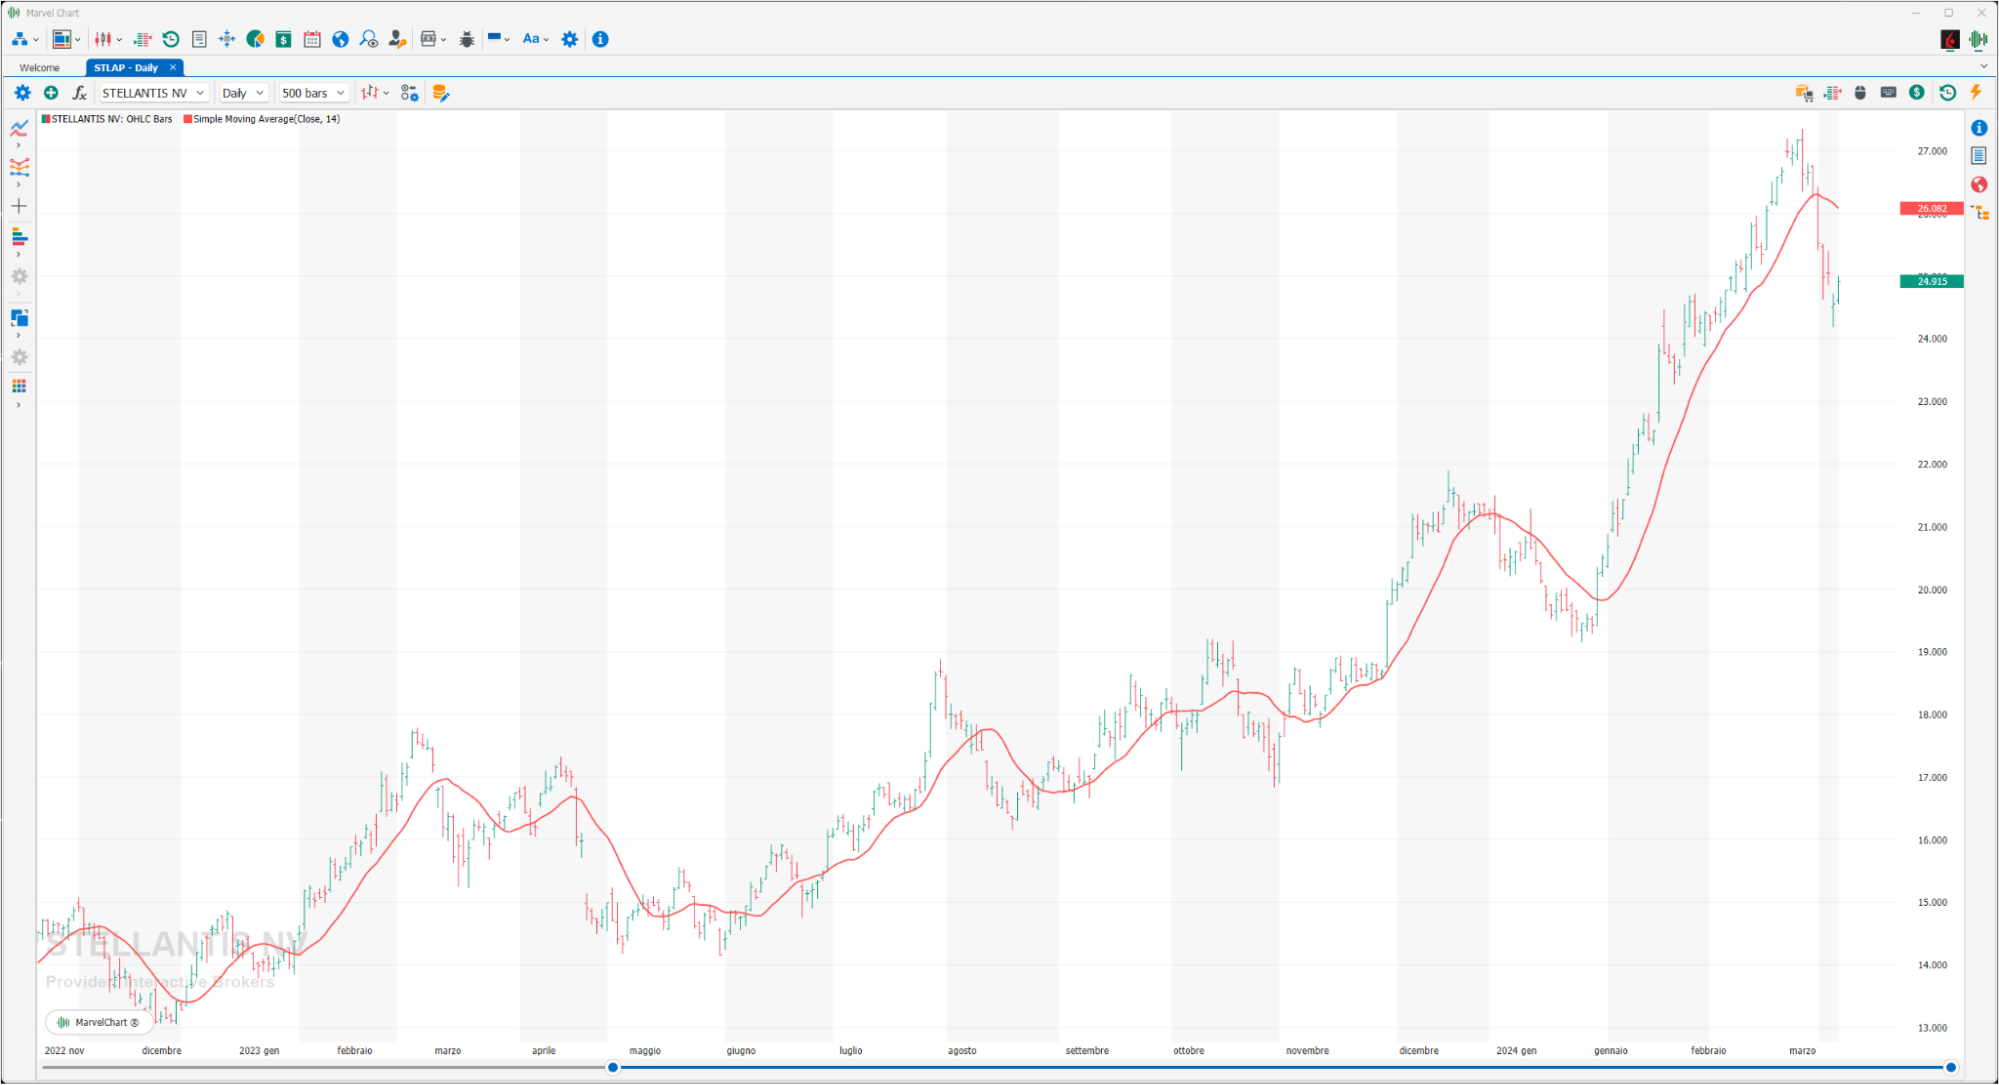
Also known as arithmetic, it remains the most used by analysts and is simpler to calculate. You take the data of a given period and calculate the average by adding them and dividing by the total number of values. However, this type of average is often criticized by many because it gives the same importance to each individual data: in a moving average over 100 periods, the last value has the same importance, 1% of "weight", as the first value.
Smoothed Moving Average
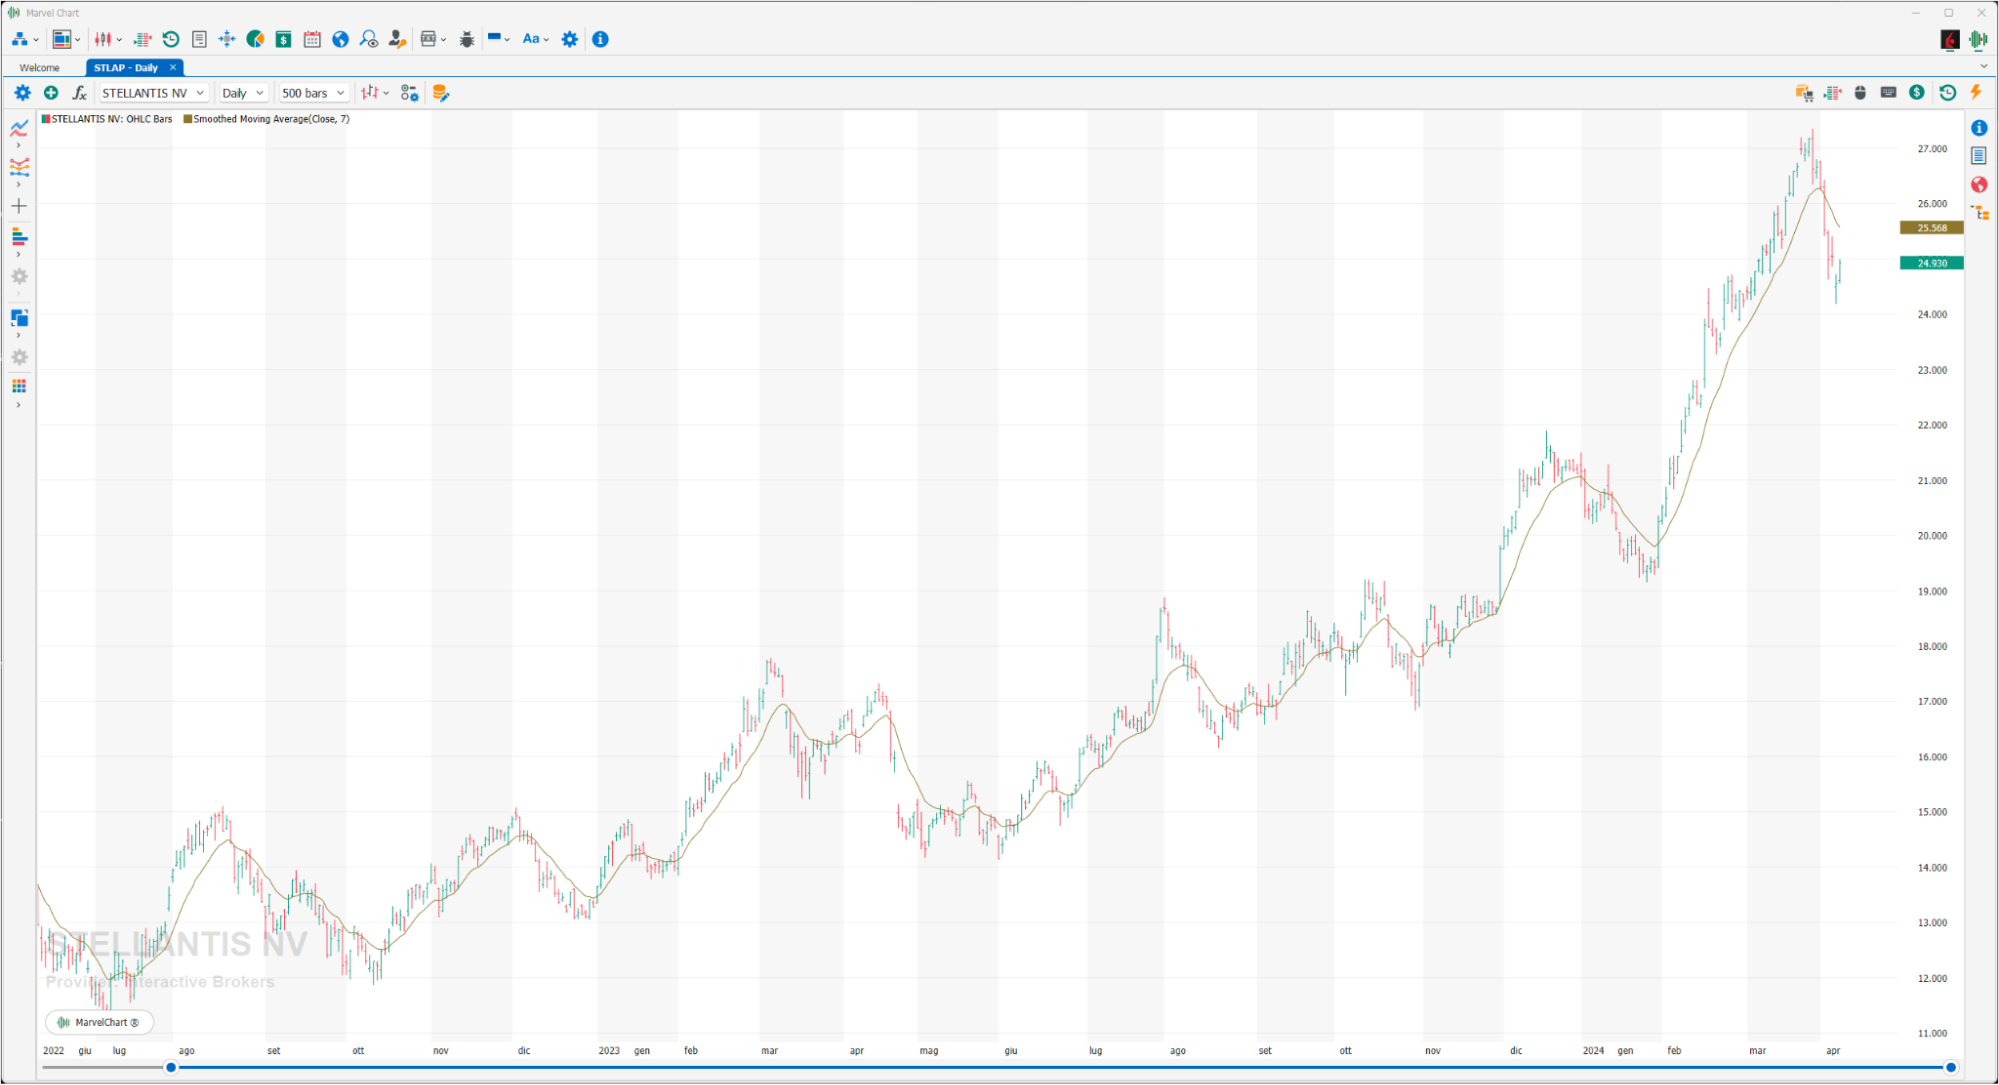
The Smoothed Moving Average compares recent prices with historical ones and ensures that they are weighted and considered in the same way. The calculation of this indicator does not refer to a specific or fixed period, but rather uses all available data in the series for analysis. The Smoothed Moving Average differs from the Exponential Moving Average (EMA) in that it is generally used with a longer time period.
TEMA
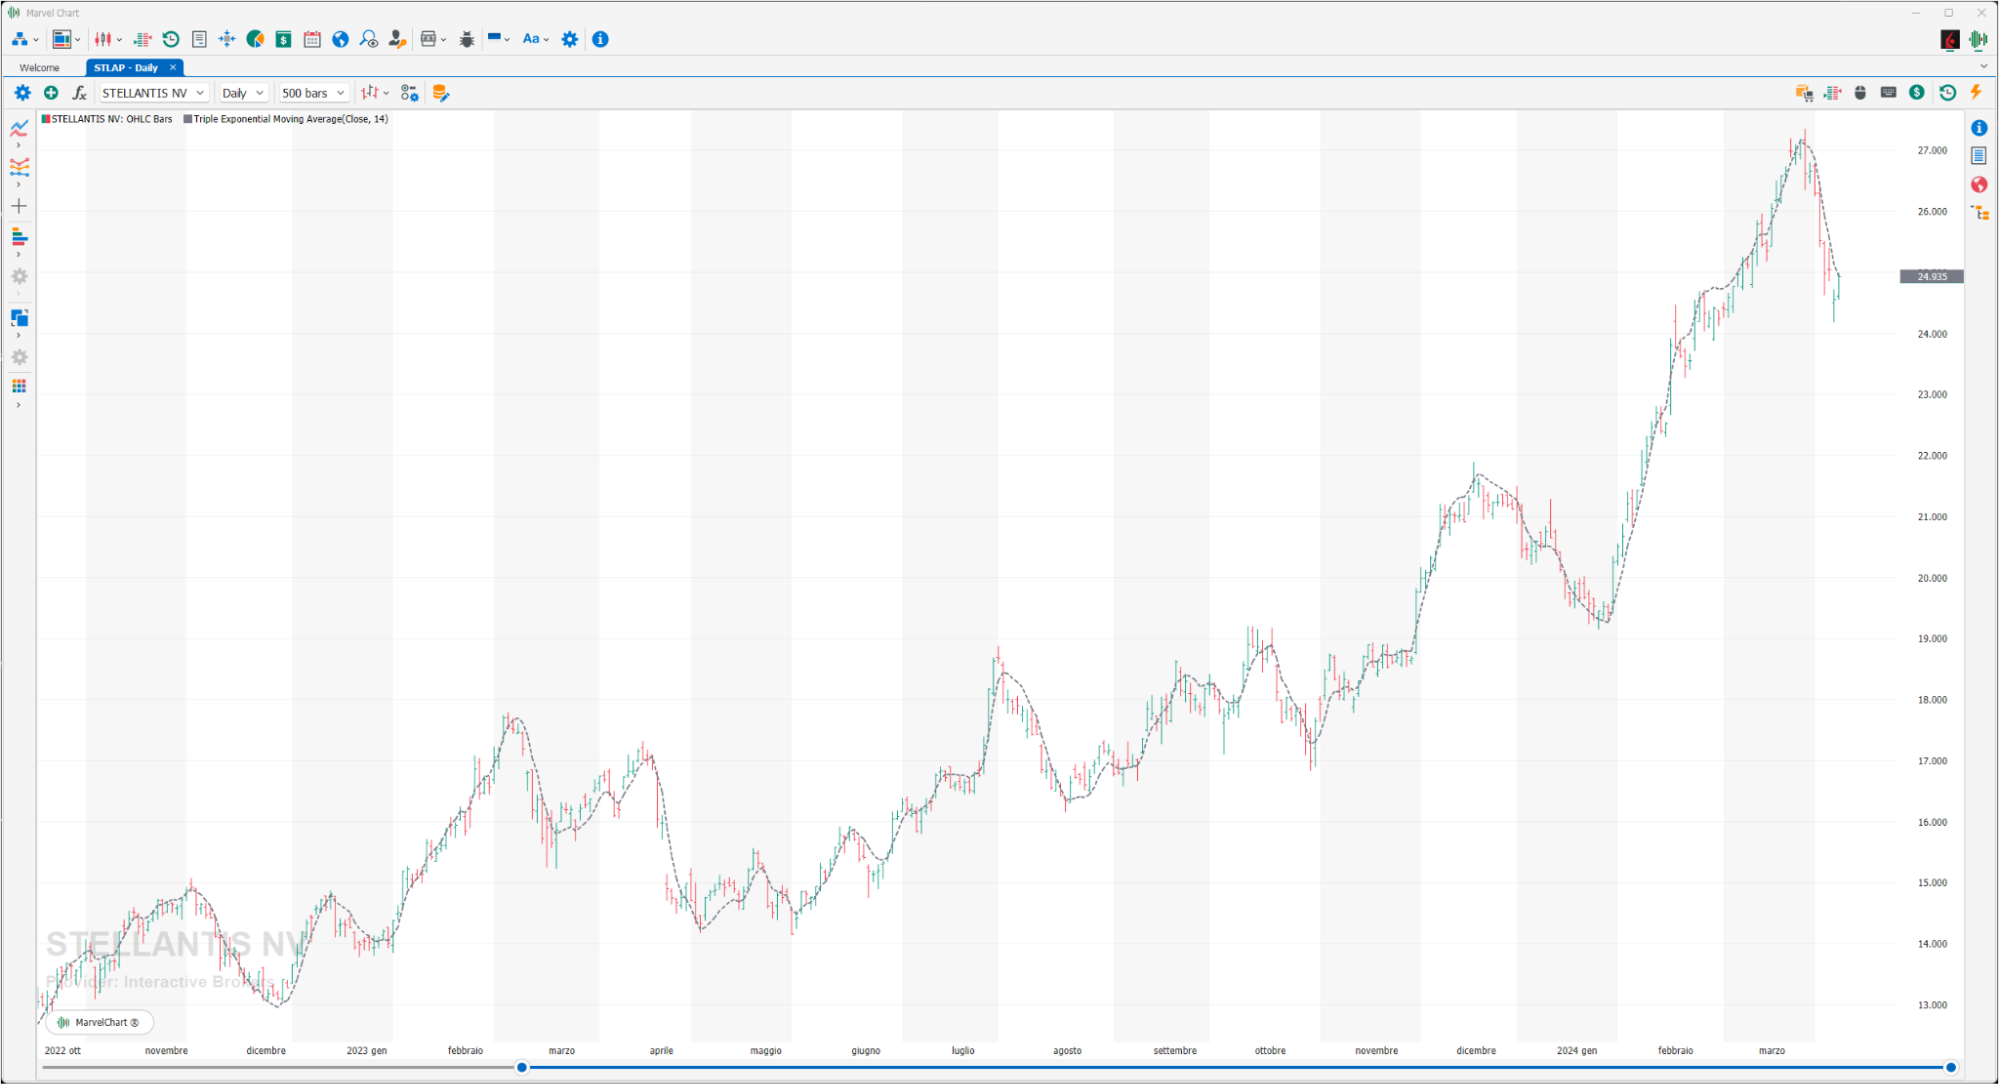
The triple exponential moving average (TEMA) was designed to smooth out price fluctuations, making it easier to identify trends without the lag associated with traditional moving averages (MAs). It does this by taking multiple exponential moving averages (EMAs) of the original EMA and subtracting some of the lag. The TEMA is used like other moving averages. It can help identify trend direction, signal potential short-term trend changes or pullbacks, and provide support or resistance. The TEMA can be compared to the double exponential moving average (DEMA).
Time Series Moving Average
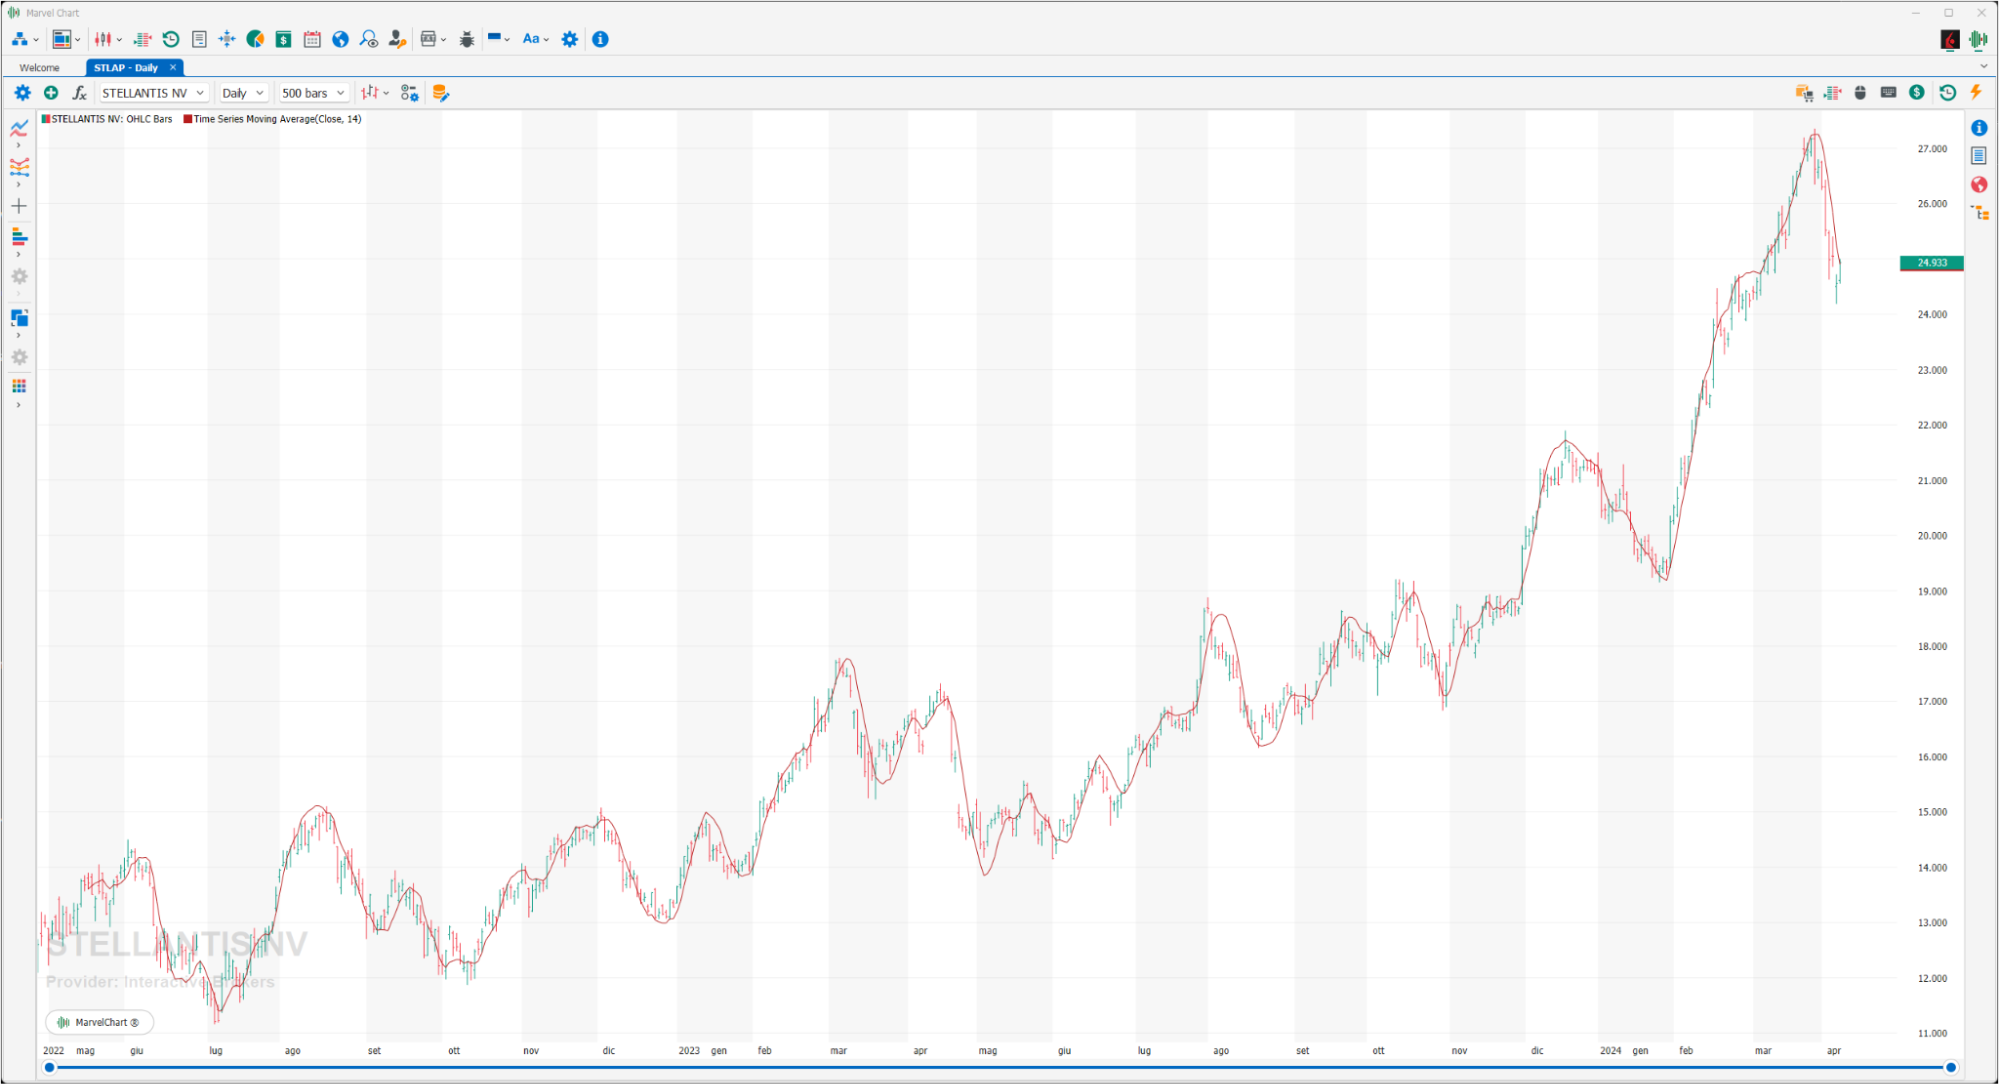
This particular type of moving average is also often called a time series forecaster. Compared to a moving average, it has two main advantages: unlike an average, the Time Series Forecast does not show a large delay; in fact, the indicator works better because it is a line that joins points of a graph rather than an average of values, the Time Series line is therefore more reactive to price variations. As the name suggests, the indicator can therefore be used to predict the price of the next periods. This estimate is based on the price trend of the underlying in a given period of time (for example 14 periods). If the trend continues, the last point of the trendline (the value of the Time Series Forecast) predicts the price of the next period (for example the day after the calculation on a daily timeframe).
Triangular Moving Average
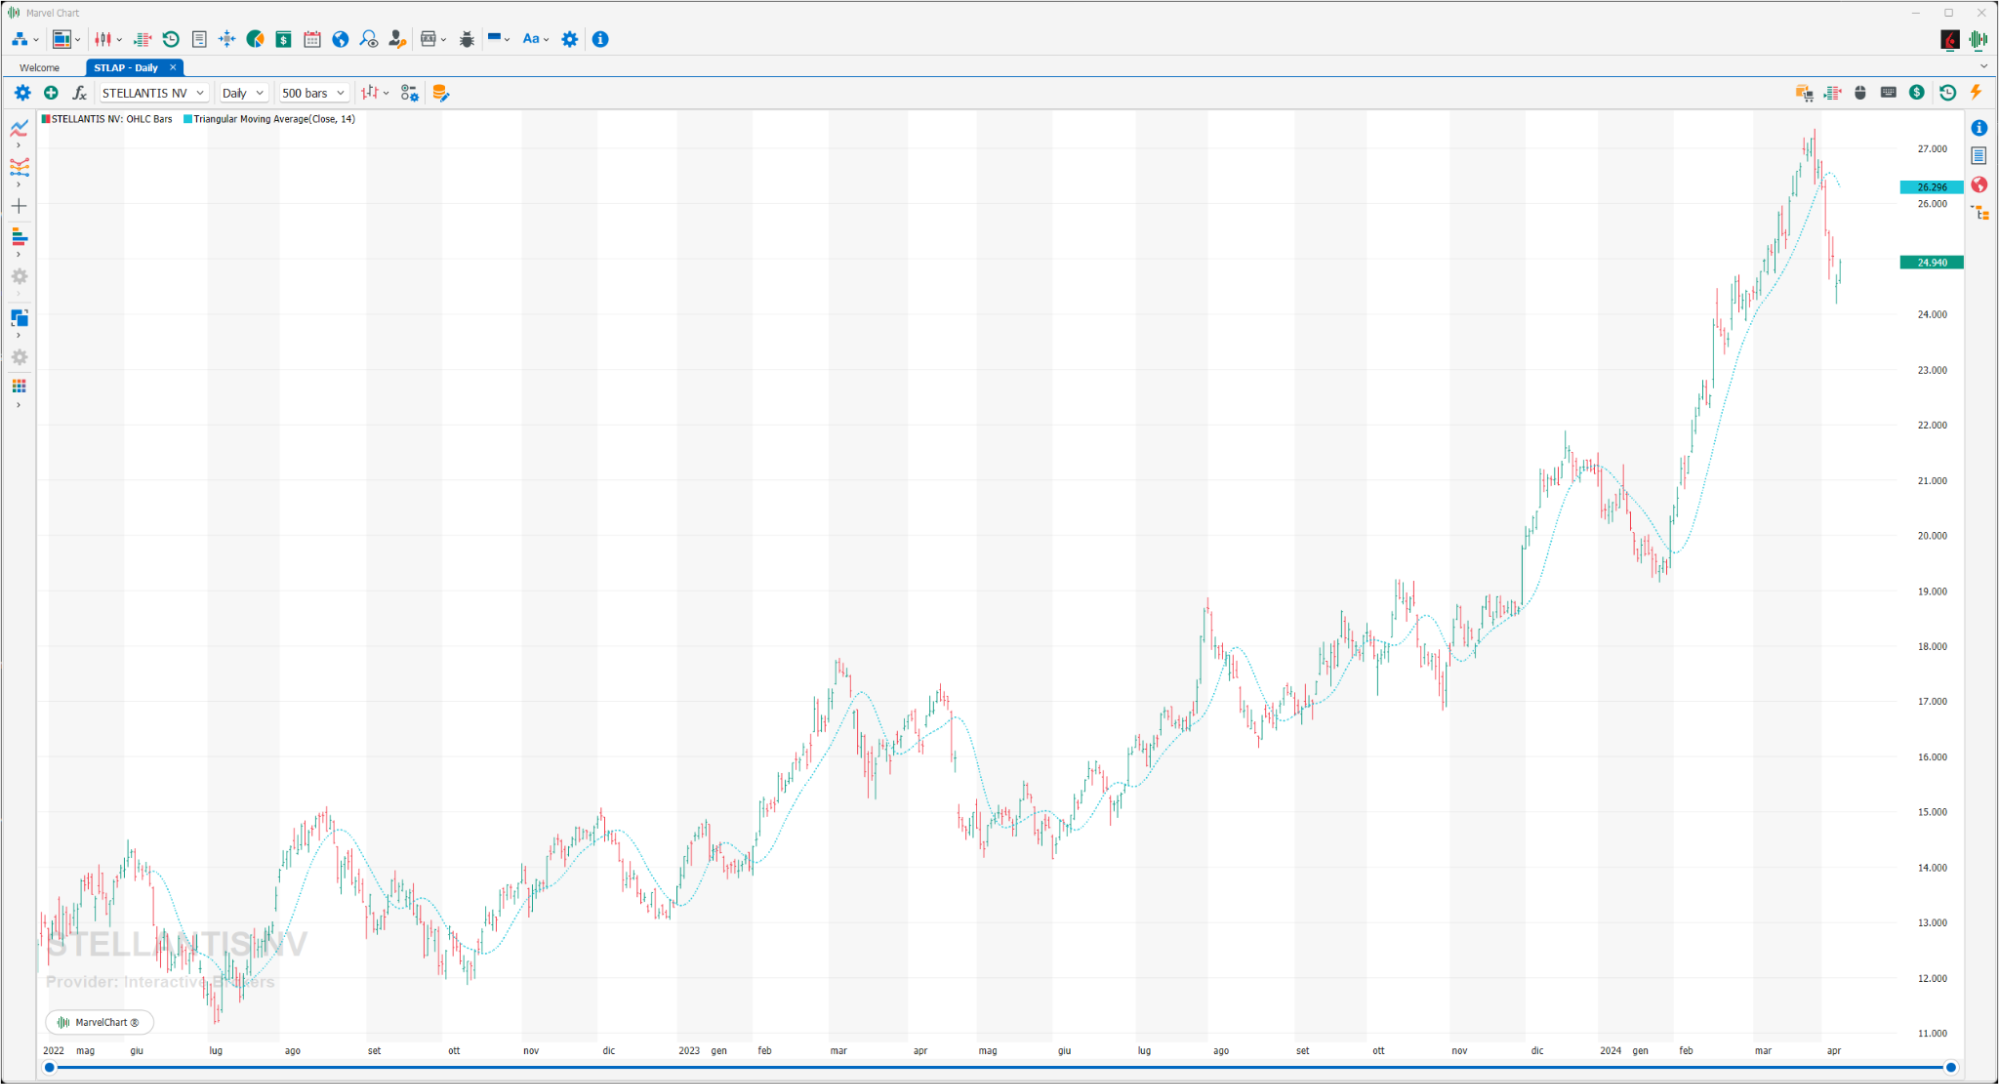
The triangular moving average has the peculiarity, compared to other moving averages, of considering, giving greater importance, the prices of the central portion of the selected period. This average is kept, compared to the others, at a greater distance from the prices, assuming a characteristic sinuous trend. However, this “harmonious wandering” can sometimes be profitable in trading.
Variable Moving Average
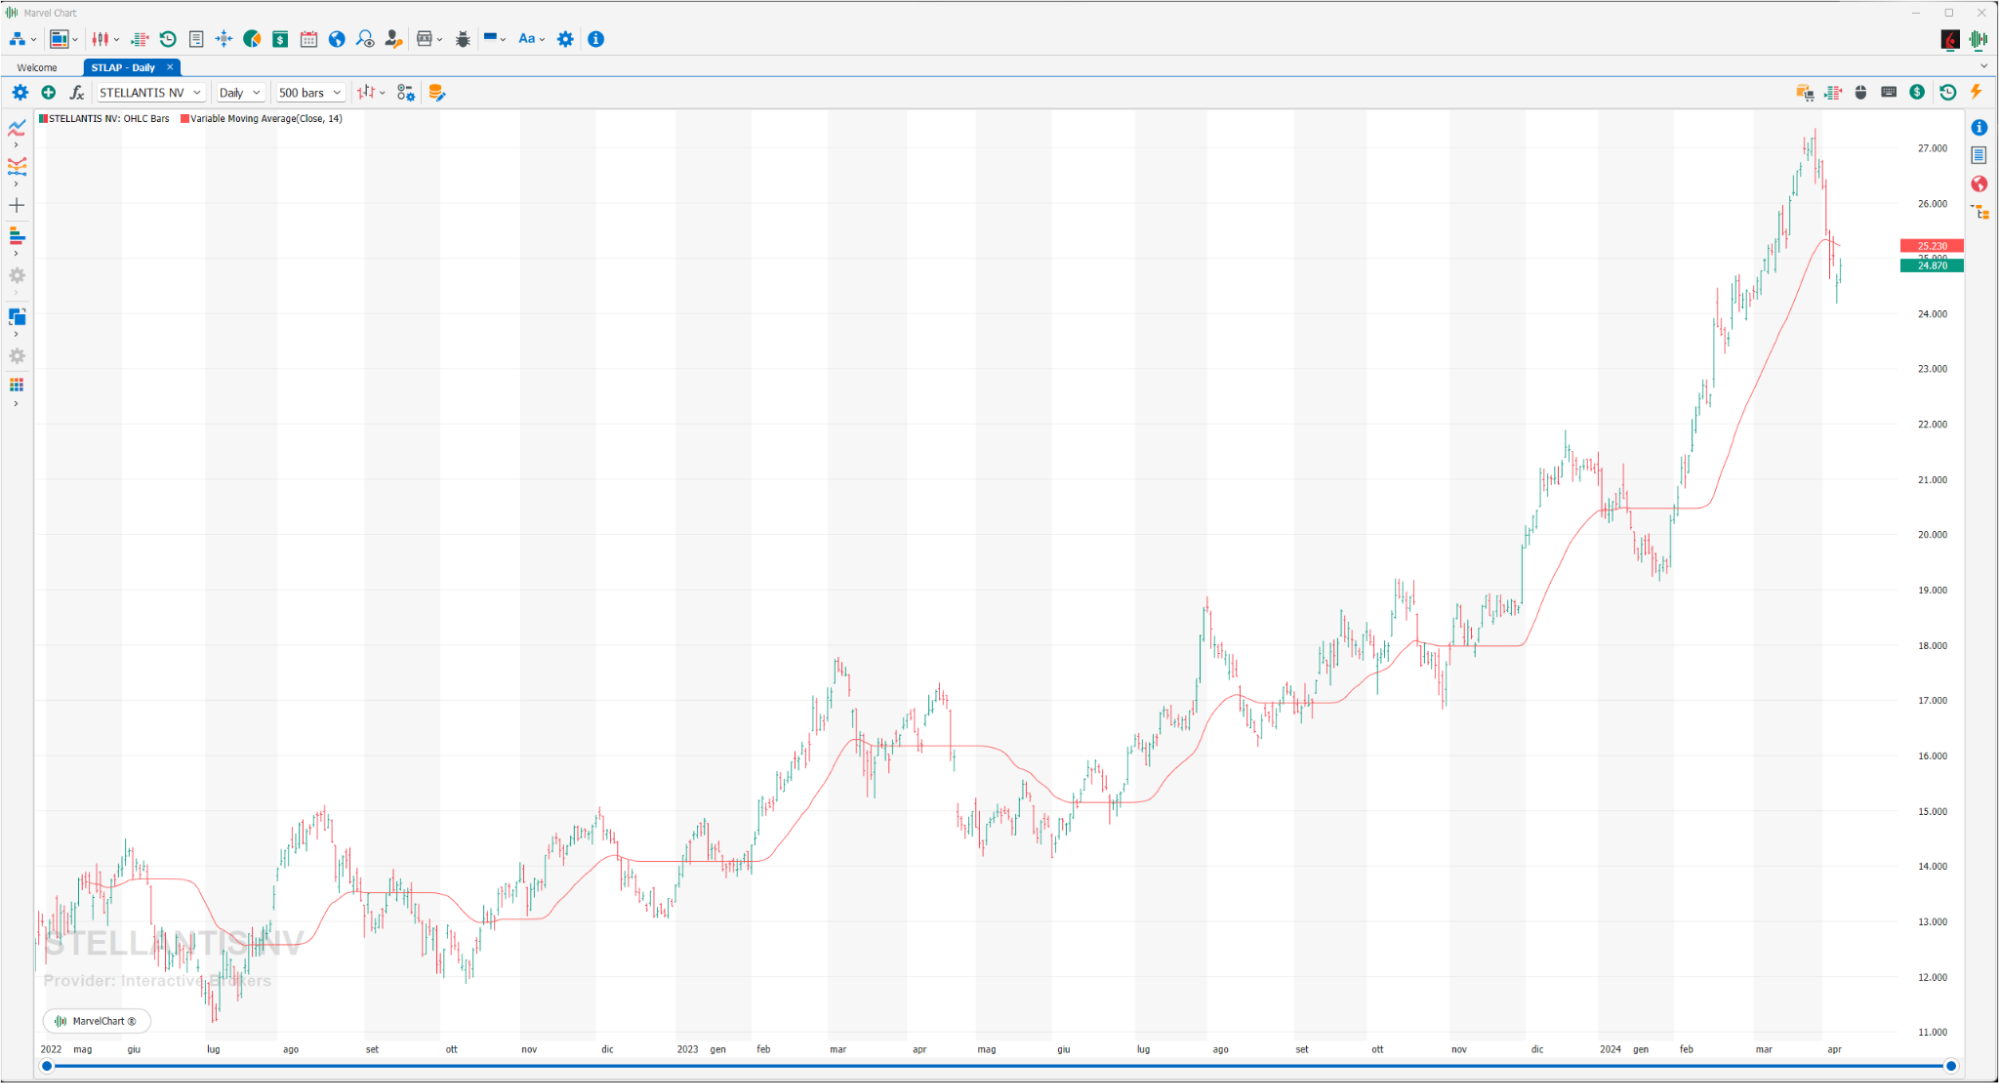
It is an exponential moving average that automatically levels itself based on market volatility. The sensitivity of the variable moving average will therefore increase as volatility increases. One of the main defects of moving averages in general is that they are not able to predict trend reversals and are not very reactive even after reversals. This particular type of moving average represents an improvement because it is leveled based on market conditions.
Variable Type Moving Average
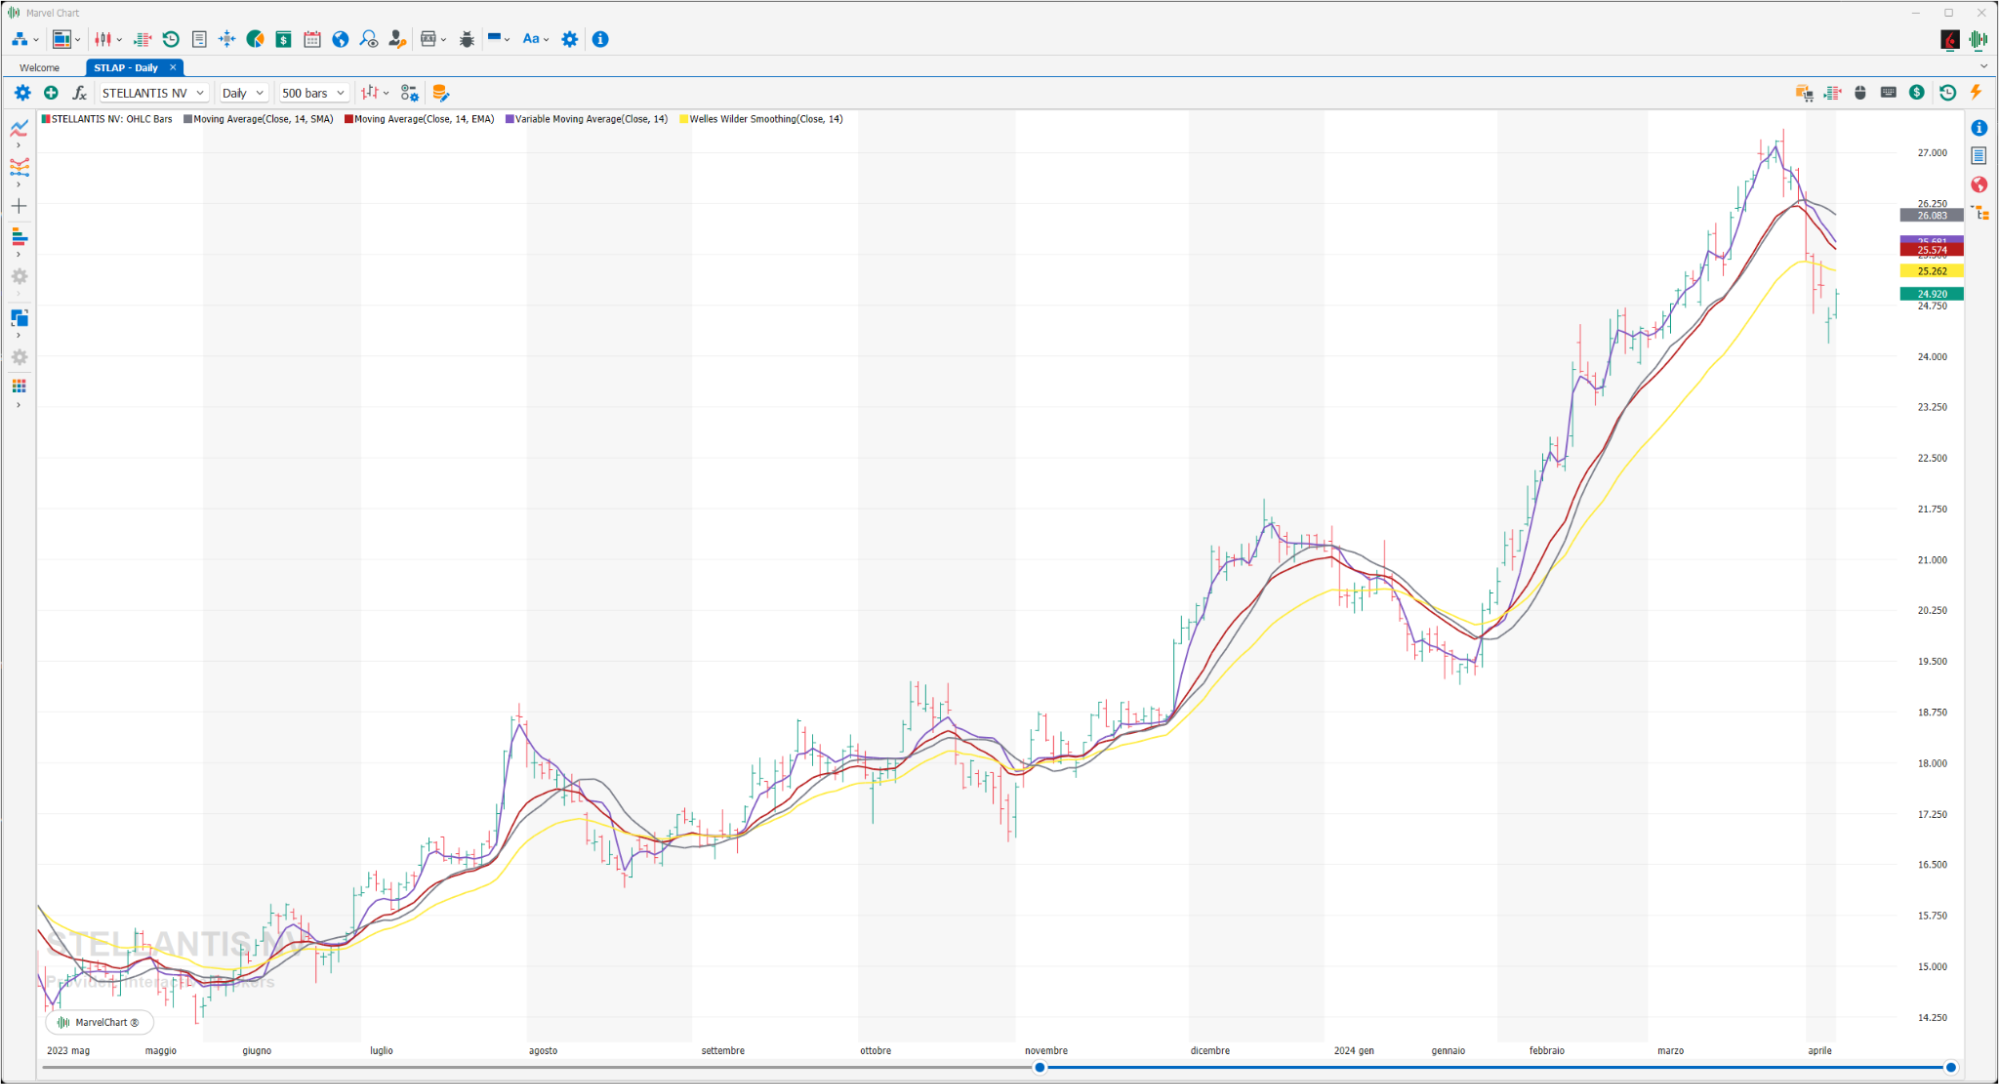
Variable Type Moving Average
VIDYA - Volatility Index Dynamic Moving Average
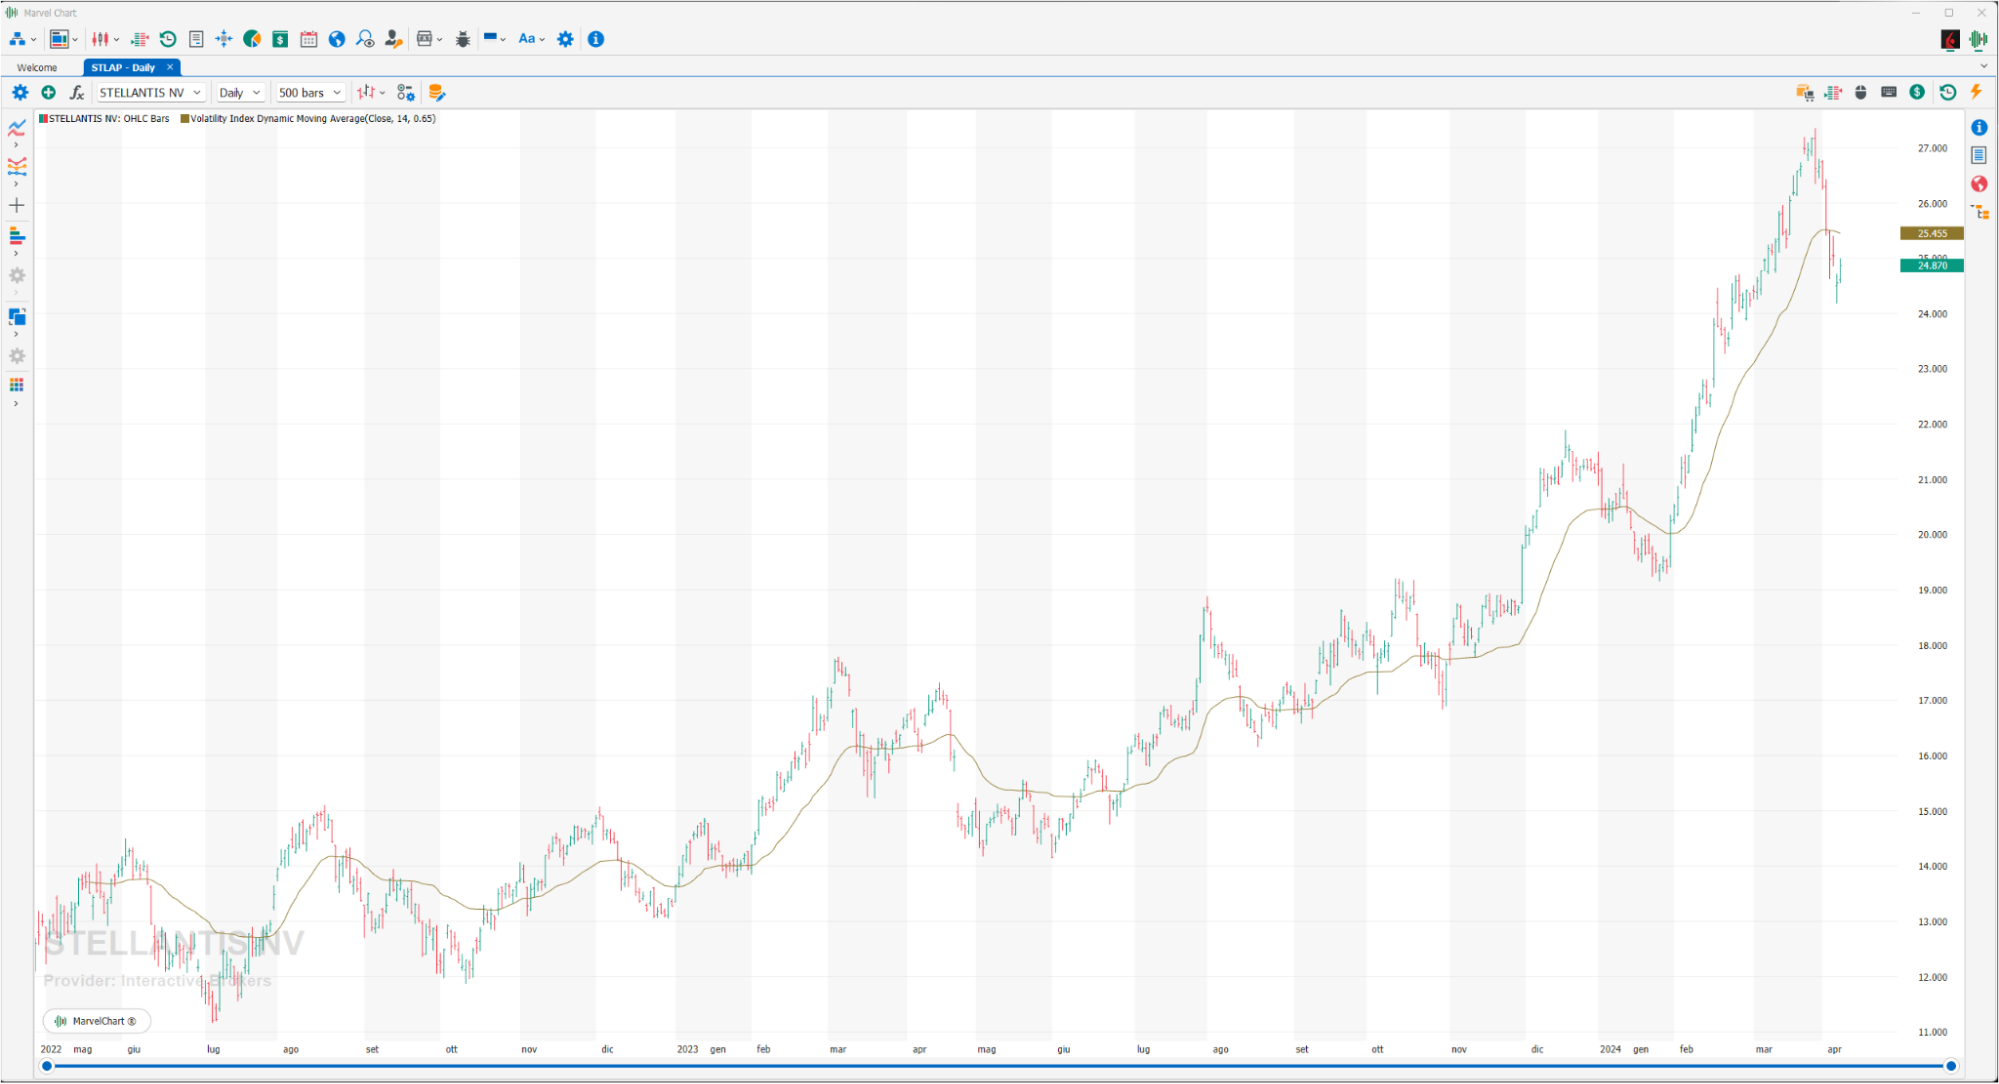
The Volatility Index Dynamic Moving Average (VIDYA), is a moving average that adapts to the volatility conditions of the market. This moving average is excellent especially when used as a support and resistance system, and crossovers are also quite reliable.
Volume Weighted Average Price
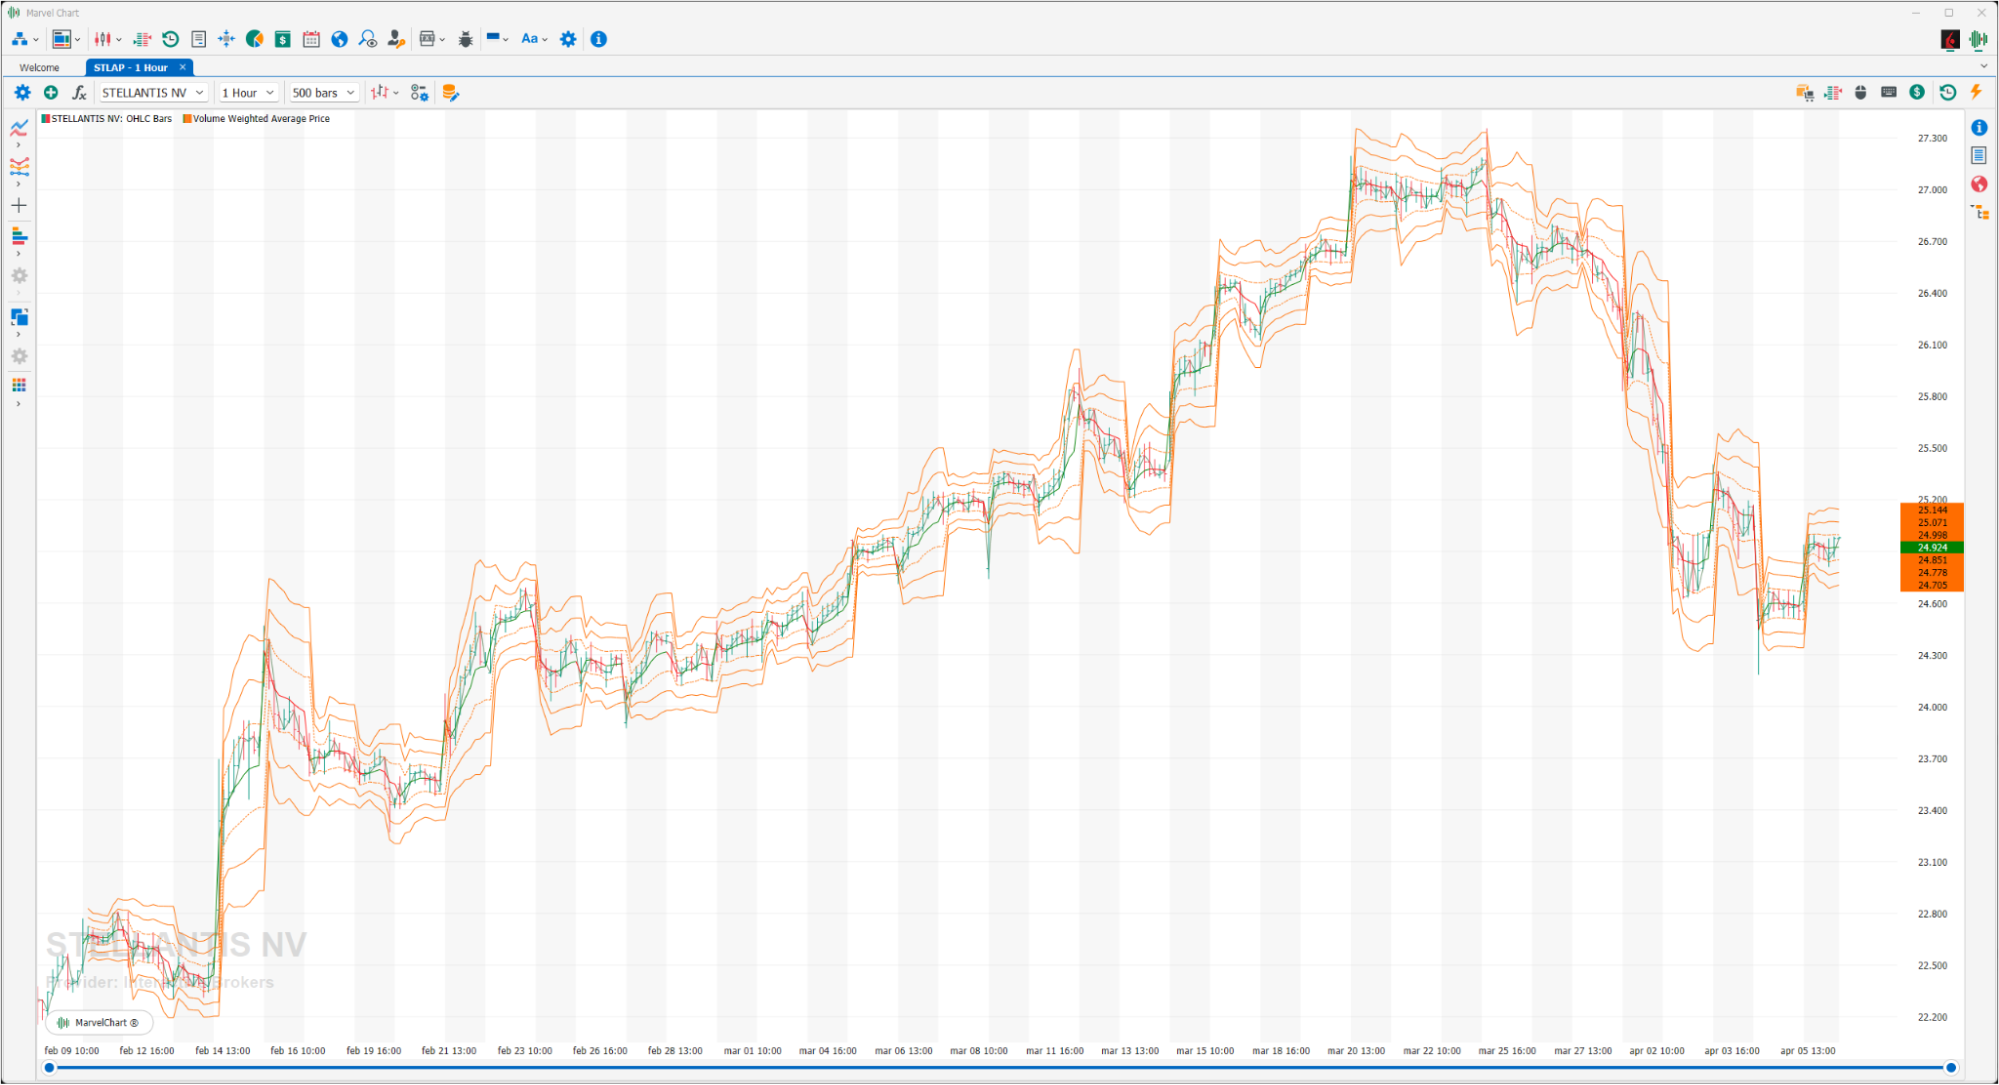
This indicator, notoriously used by institutional investors as a reference for the execution of large orders divided into multiple operations, is also becoming very popular among small traders. The Volume Weighted Average Price measures the average price at which trades take place in a given period of time. The calculated VWAP is then extended by its standard deviations, determining bands to be understood as supports and resistances, with particular attention to the second band. The median is painted green when the VWAP is increasing, or red when the VWAP is decreasing. The operational definition is that in a trading day, strong hands buy on the weakness (second band) and sell on the median (VWAP), the price of the asset will therefore detach between the bands. On a day of strong trend, however, the price will exit the bands.
Volume Weighted Moving Average
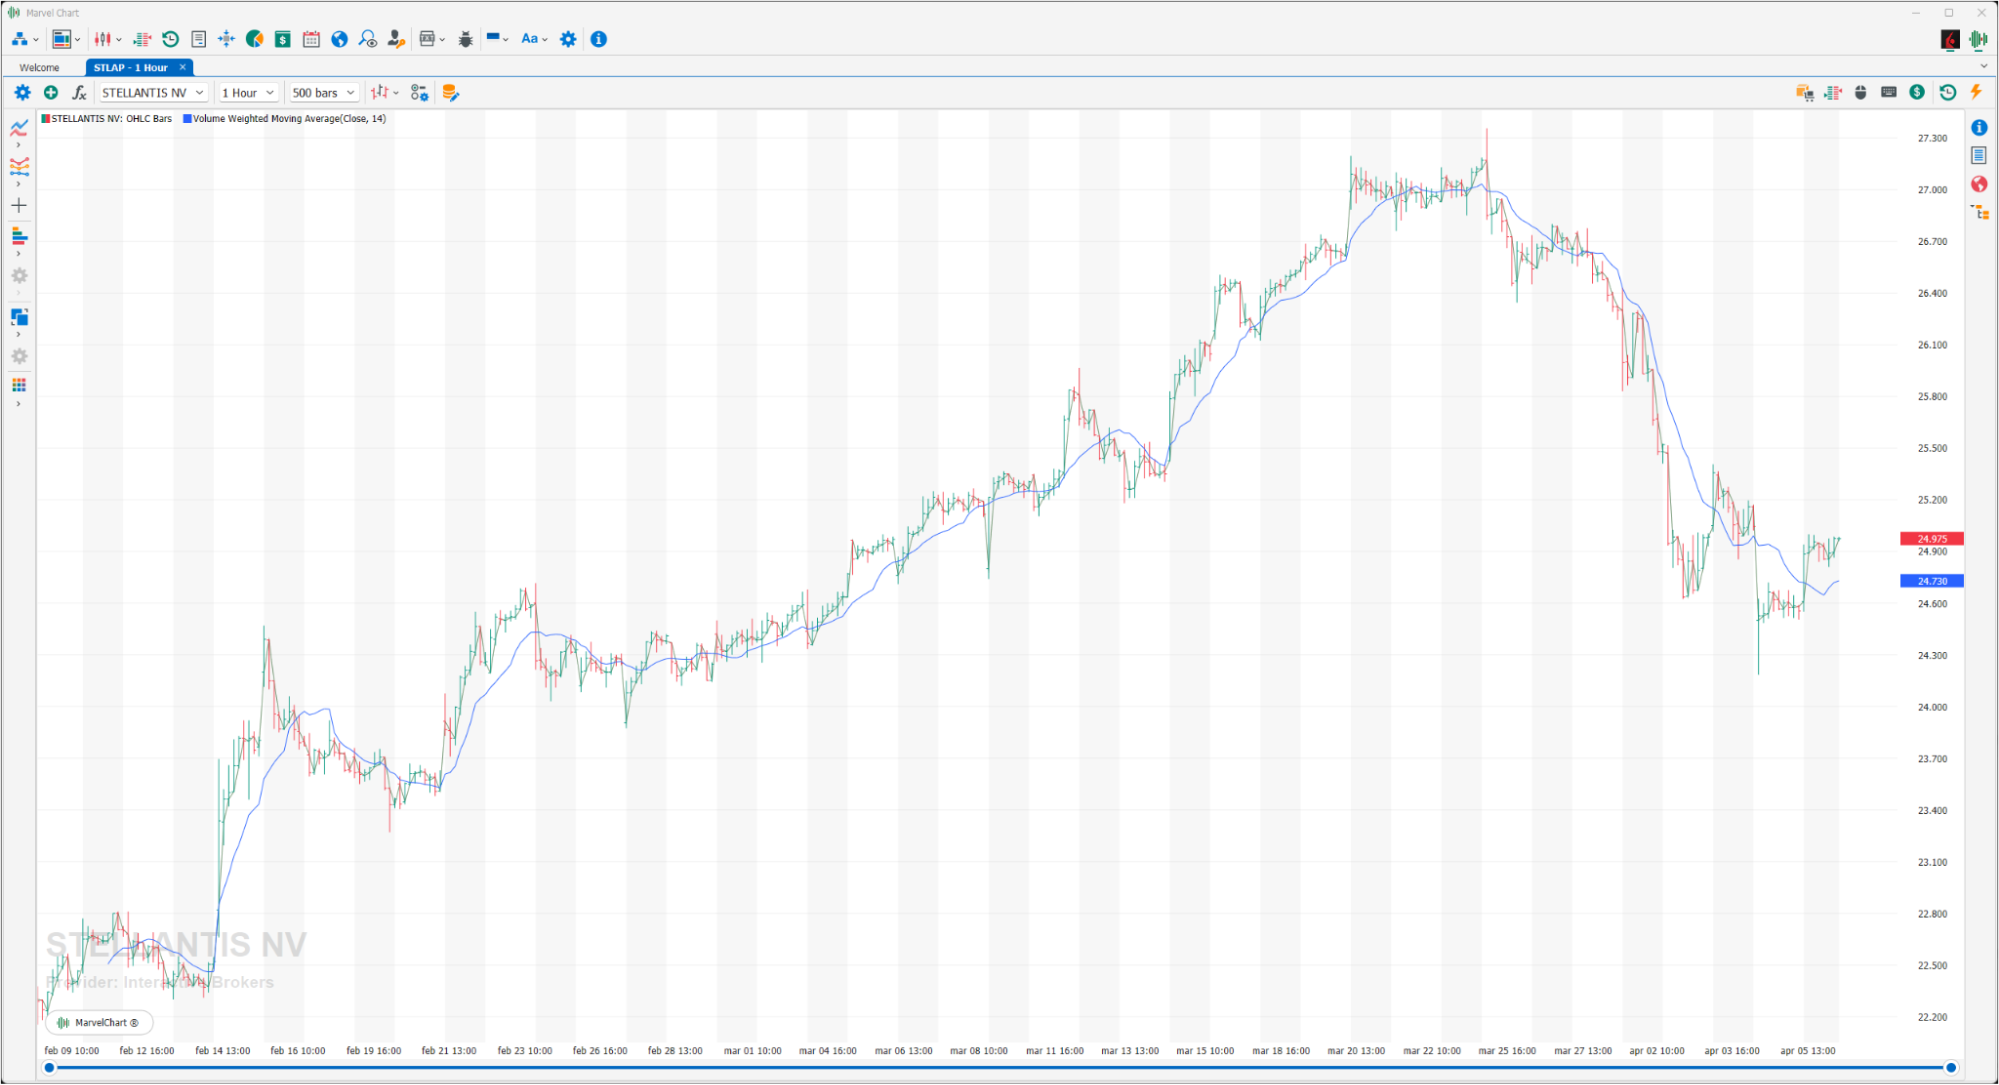
The Volume Weighted Moving Average indicator calculates the volume-weighted average price over a period of N bars.
Weighted Moving Average
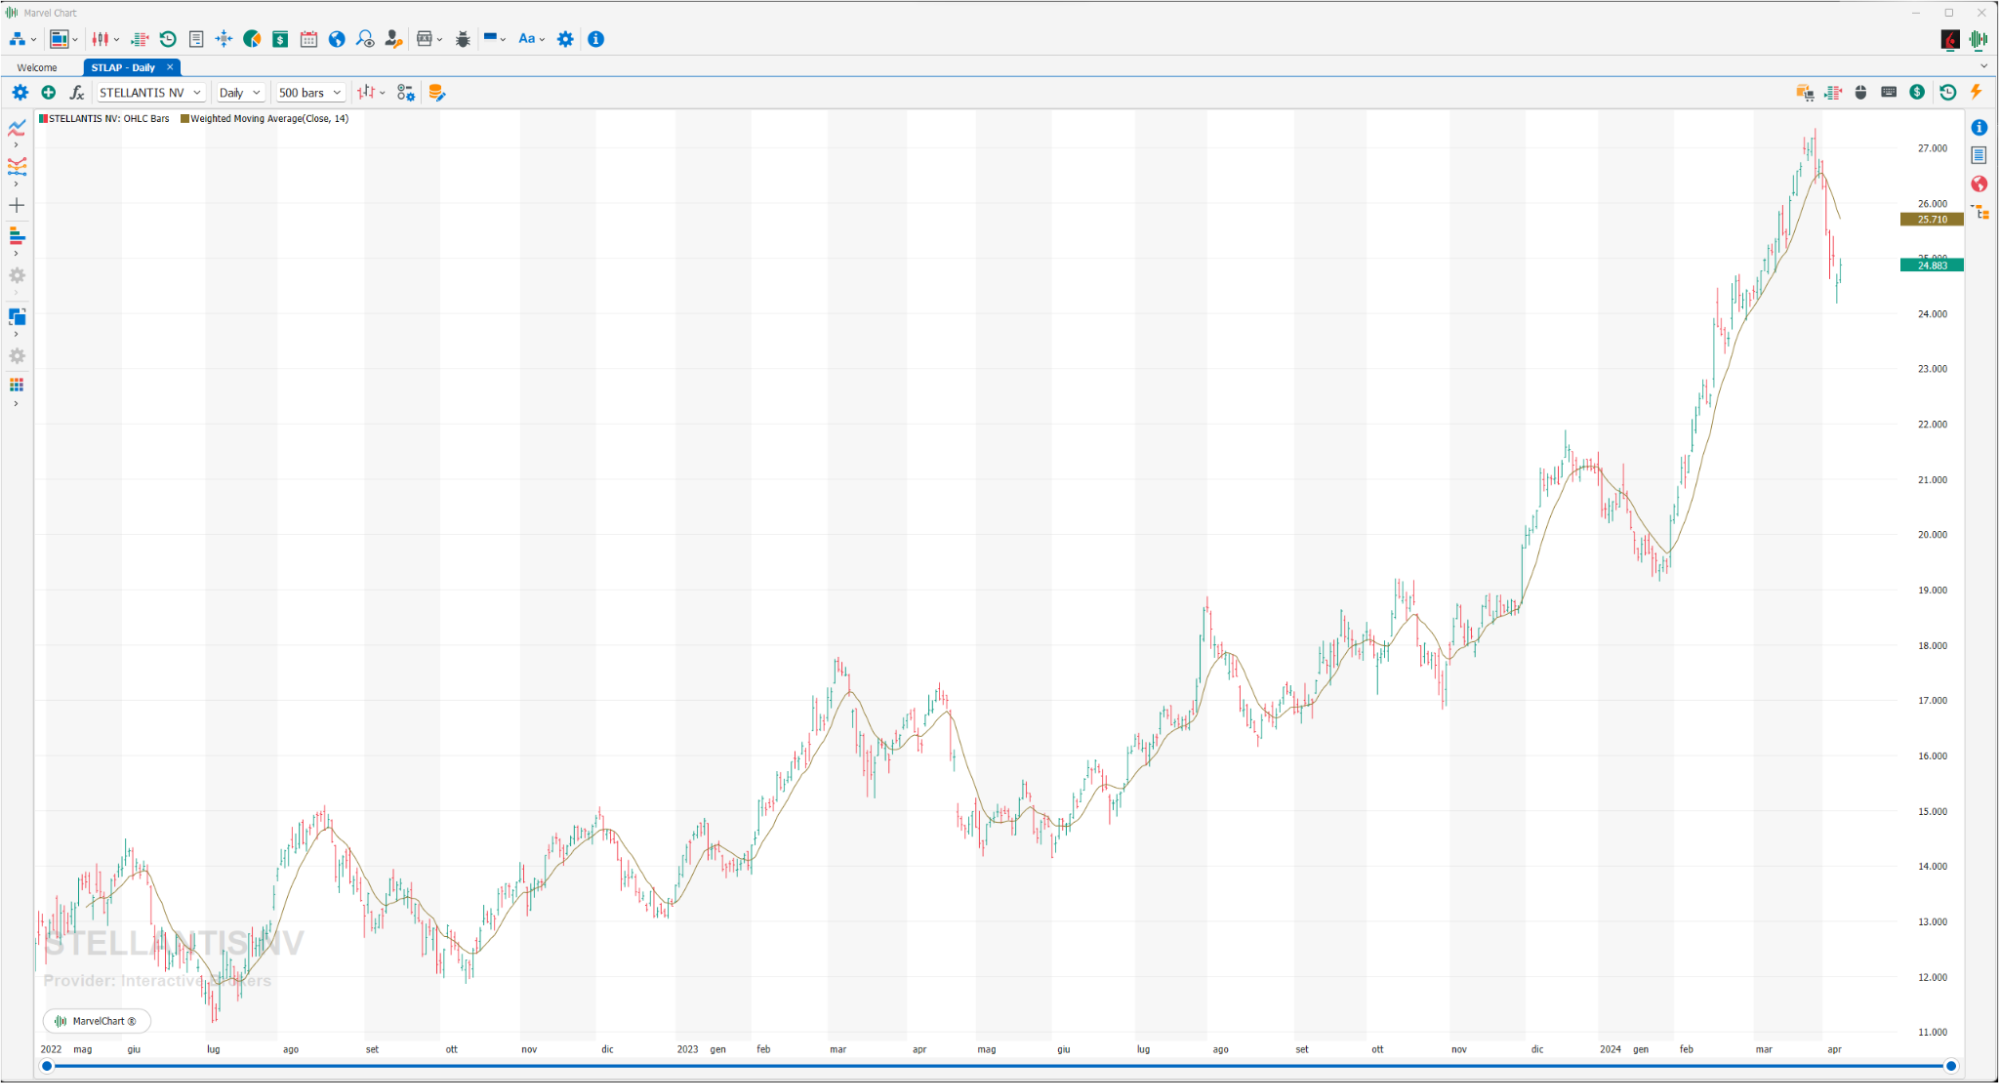
A Weighted Moving AVerage gives more weight to recent data and less to past data. This is done by multiplying the price of each bar by a weighting factor. Because of its unique calculation, the WMA will follow prices more closely than the corresponding simple moving average. Use the WMA to determine the direction of the trend. It could be a buy signal when prices fall near or just below the WMA. It could be a sell signal when prices fall near or just above the WMA.
Welles Wilder Smoothing
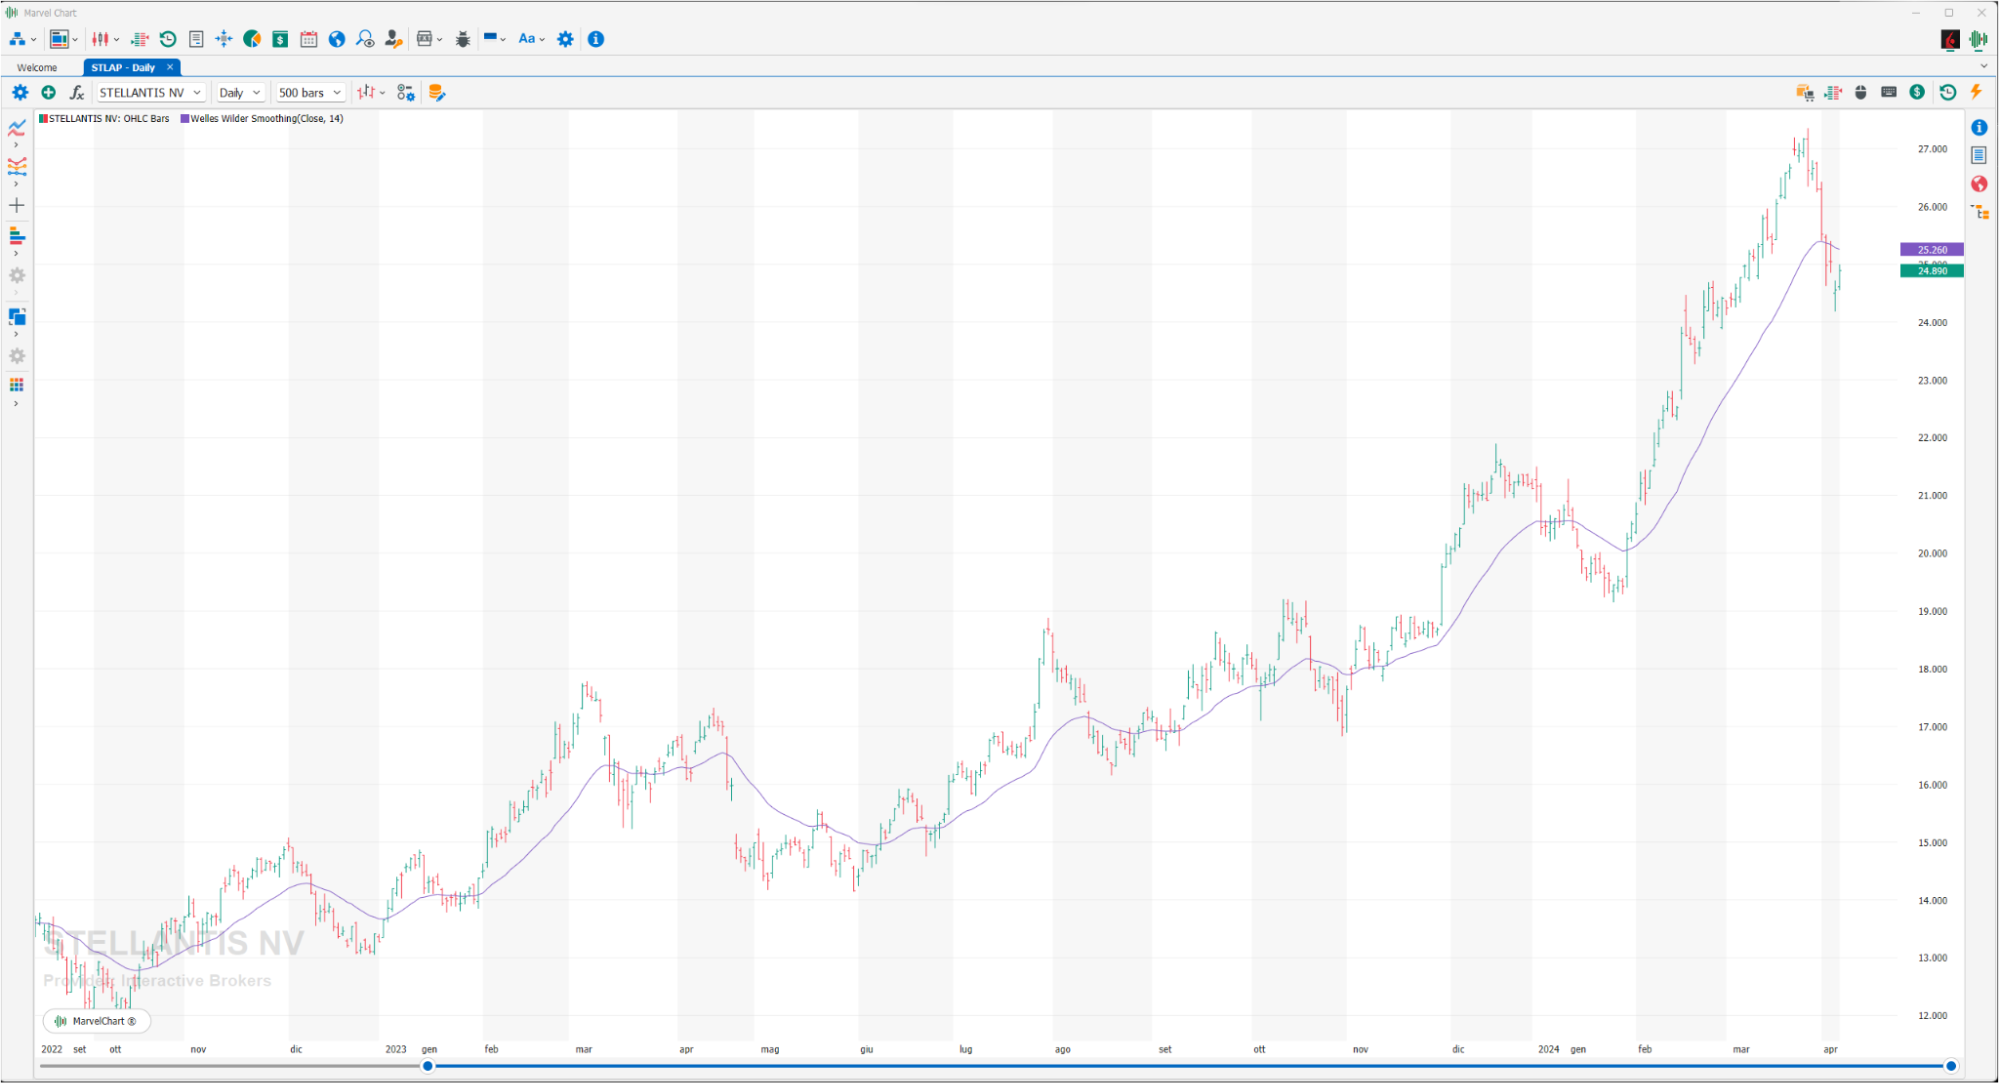
The moving average developed by Welles Wilder is nothing more than a moving average calculated by maintaining a decreasing percentage of all the values present in the historical series. The use of this indicator is typical of a moving average.