Adaptive
Adaptive Center of Gravity Oscillator
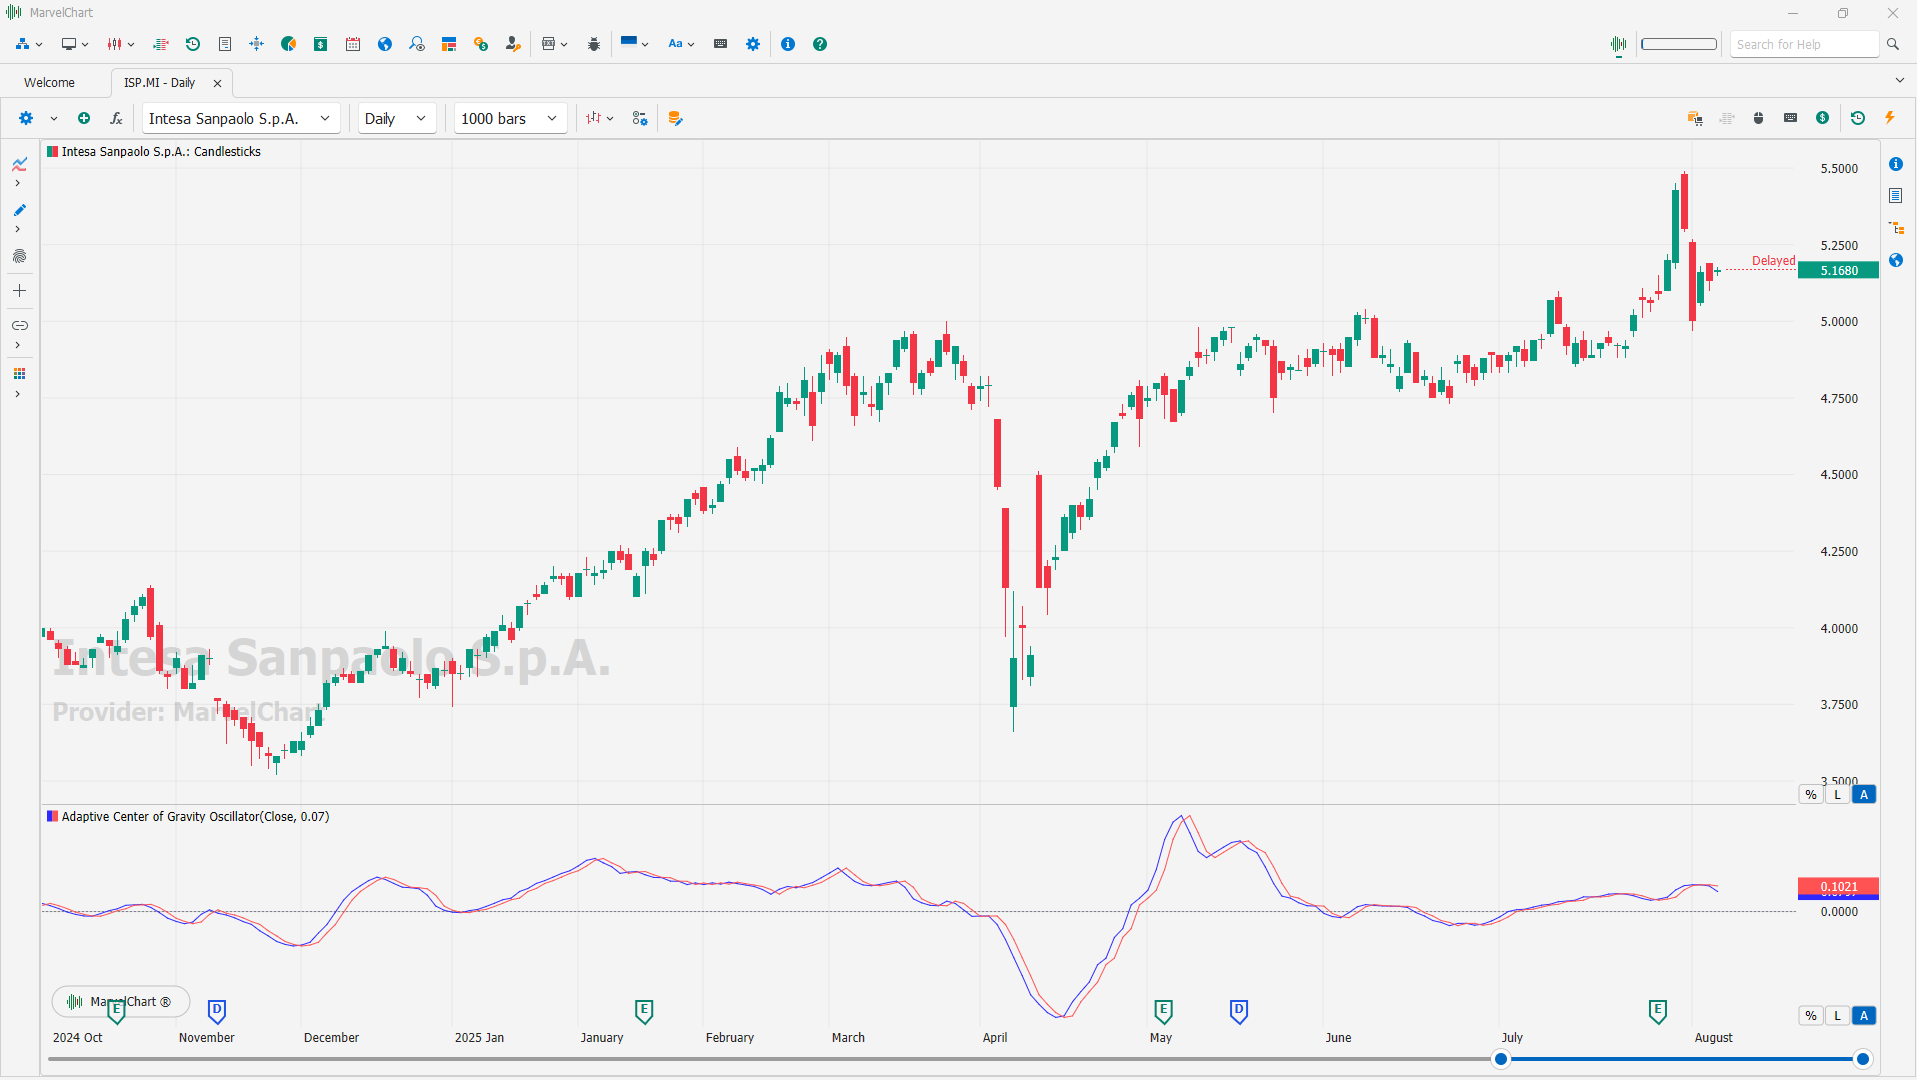
The Adaptive Center of Gravity (COG) Oscillator is a technical indicator designed to predict price reversals by calculating a weighted average of past prices, with a focus on responsiveness and foresight. It was developed by John Ehlers as an adaptation of the original Center of Gravity indicator, incorporating the current cycle period for more dynamic analysis. This makes it more responsive than the standard COG, potentially providing earlier buy and sell signals.
Purpose
The Adaptive COG aims to identify potential price reversals and turning points in the market, helping traders anticipate changes before they fully develop.
Lag Reduction
By adapting to the current cycle period, the indicator aims to reduce lag, making it a more forward-looking tool compared to traditional lagging indicators.
Weighted Average
Like the standard COG, it calculates a weighted average of past prices, giving more emphasis to recent data for increased accuracy.
Cycle Period Adaptation
The key difference is the dynamic calculation of the alpha (a parameter in the COG formula) based on the dominant cycle period, which is derived from cycle analysis.
Buy and Sell Signals
Traders often look for crossovers between the COG line and a signal line (often another moving average) to identify potential buy and sell opportunities.
Contextual Use
While the Adaptive COG is strong at predicting reversals, it's generally recommended to combine it with other indicators, especially in sideways markets, to filter out potential false signals.
How it differs from the standard COG
The Adaptive COG uses the dominant cycle period to calculate its alpha, whereas the standard COG uses a static period. This adaptation makes the Adaptive COG more responsive to changes in the market's underlying cycle.
Adaptive Commodity Channel Index
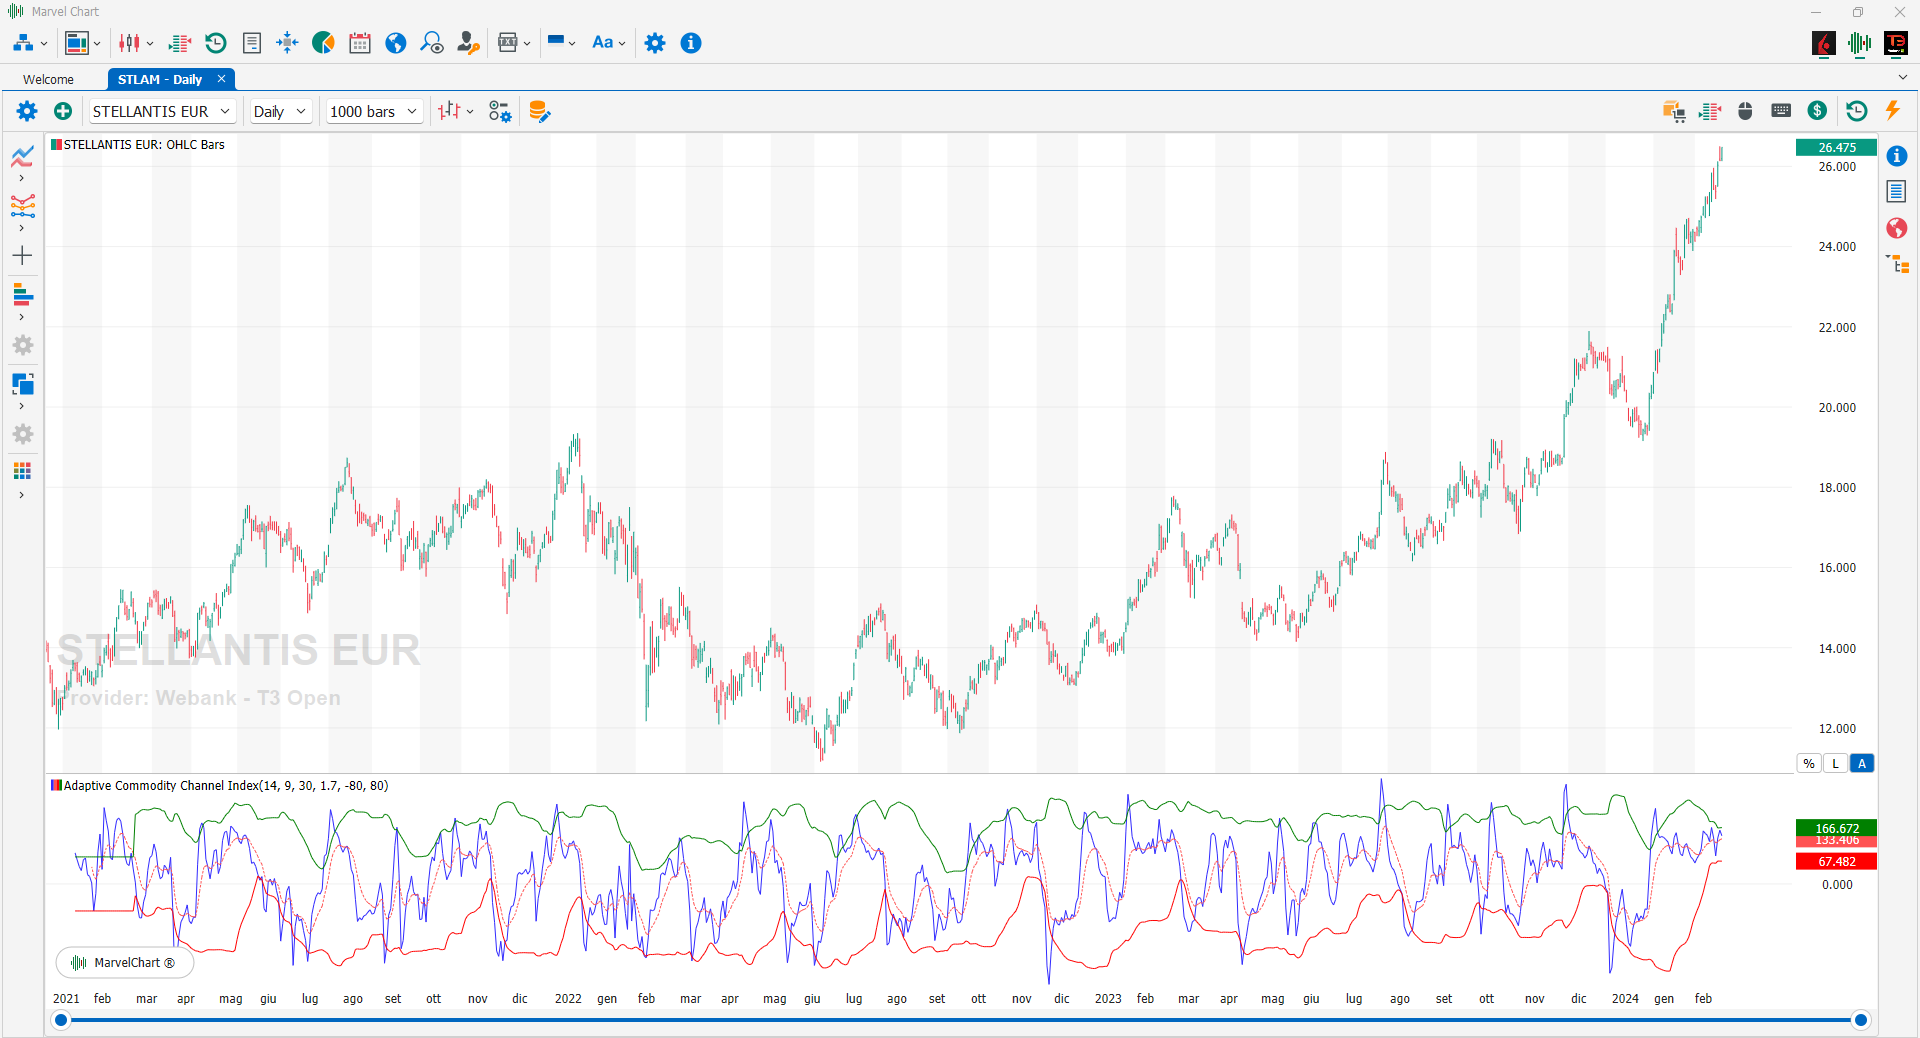
The CCI (Commodity Channel Index) is an oscillator created by Donald R. Lambert to identify cyclical changes in the commodity market. The basic hypothesis of the CCI is that commodities move cyclically, with the formation of highs and lows at periodic intervals. Practically this oscillator is also used on stocks and bonds and more generally on all markets that have strong cyclicality. The construction of the Commodity Channel Index starts from the calculation of the “Typical Price” and its “Simple Moving Average” at 20 periods. Lambert recommends using a third of the cycle length as the period for calculating the CCI, so if the cycle lasts 60 periods, a 20-period CCI will be used. The average deviation is then calculated and the CCI indicator is constructed as the ratio between the difference between the typical price and its moving average and the average deviation multiplied by a constant equal to 0.015. The constant 0.015 introduced by Lambert allows the oscillator to have values that are in the majority (70-80%) of cases between +100 and -100. The CCI is therefore used as a real oscillator, highlighting overbought situations when it is above +100 and oversold situations when it is below -100. Furthermore, the Commodity Channel Index provides divergence signals from prices and these are much stronger when they occur mostly in the excess positions of the indicator.
Adaptive Relative Strength Index
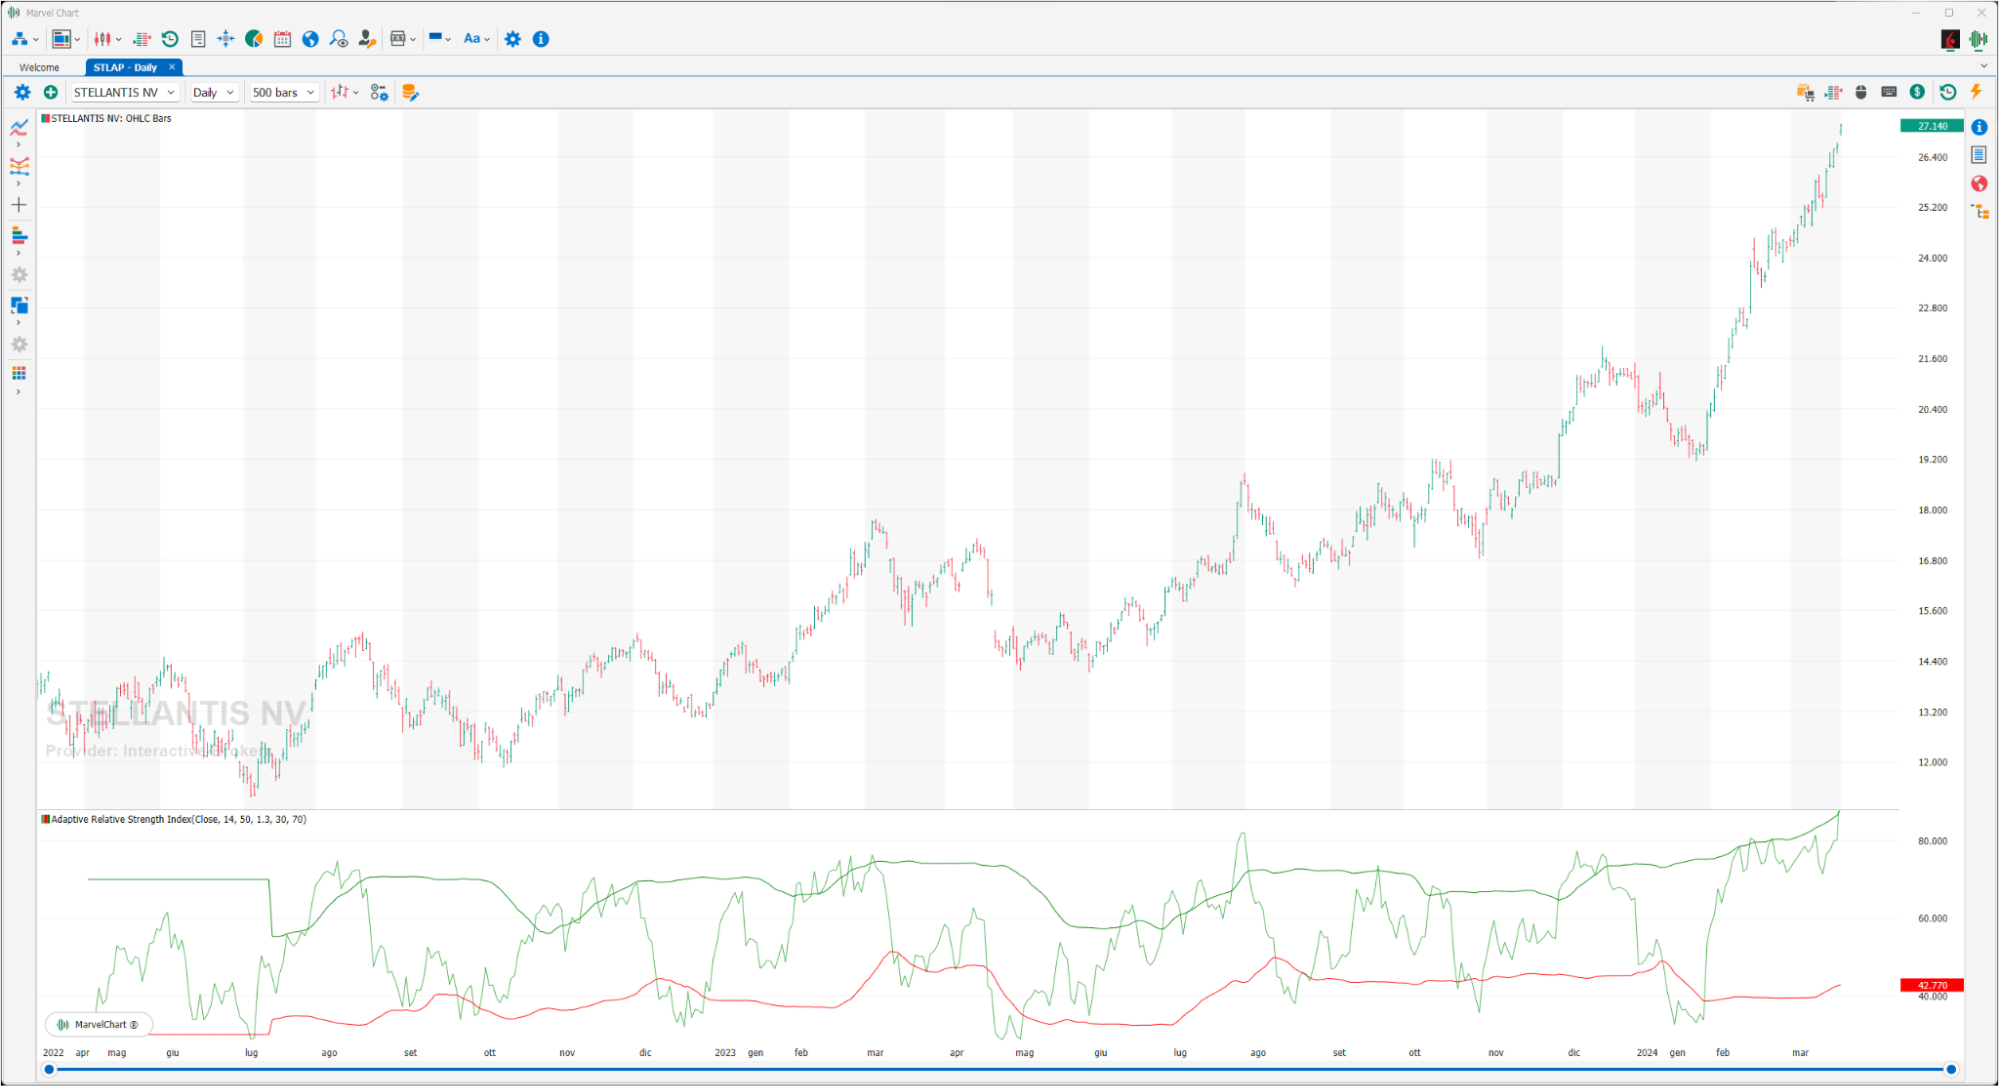
The Relative Strength Index, created by John Welles Wilder, is one of the most widely used technical analysis oscillators by traders, especially those dealing with futures. It is a momentum indicator, which however manages to overcome some problems present in the momentum of other oscillators that generate considerable complications in their interpretation, especially when sudden movements of the market occur causing a sudden reversal. It is therefore necessary, for a correct and more understandable analysis, to minimize such distortions. The Relative Strength Index, in addition to solving this problem, has a constant oscillation band, from 0 to 100, which allows a comparison of the values with some predetermined constant levels. By presenting a constant excursion band, from 0 to 100, it is possible to identify fixed zones in which the oscillator is in an extreme situation; they will therefore be considered overbought zones when the oscillator records values higher than 70, while we will be oversold if it shows values lower than 30. It should be noted, however, that the classic doctrine of technical analysis identified these extreme levels as 80 and 20, rather than 70 and 30. The signals generated by this oscillator are similar to those of many others. The median line of 50 should be considered as the watershed between a bullish and a bearish market. The intersection of the RSI line with this level can be considered a BUY or SELL signal. But much more important and interesting are, however, the bullish or bearish divergences that can be identified in extreme zones. These signals must be monitored very carefully because they can be classified as very worrying situations; the creator himself considers divergences to be the most indicative characteristic of this oscillator. However, it should be remembered that a strong market prematurely generates overbought or oversold signals and this can lead to hasty exits from a trend that is still potentially valid; in fact, overbought phases during a bull market can last a long time, like oversold phases during a bear market. Another way to identify market entry and exit signals thanks to this oscillator is through the use of the 30 and 70 lines, which delimit extreme situations. For example, in the case of a bear market that generates an oversold situation, with the oscillator therefore well below the 30 line, it could be interesting to take bullish positions once the value has returned above that level. This would be an entry with a reasonable margin of risk, but it could prove to be an excellent and timely entry in view of a new bullish movement.
Adaptive Relative Vigor Index
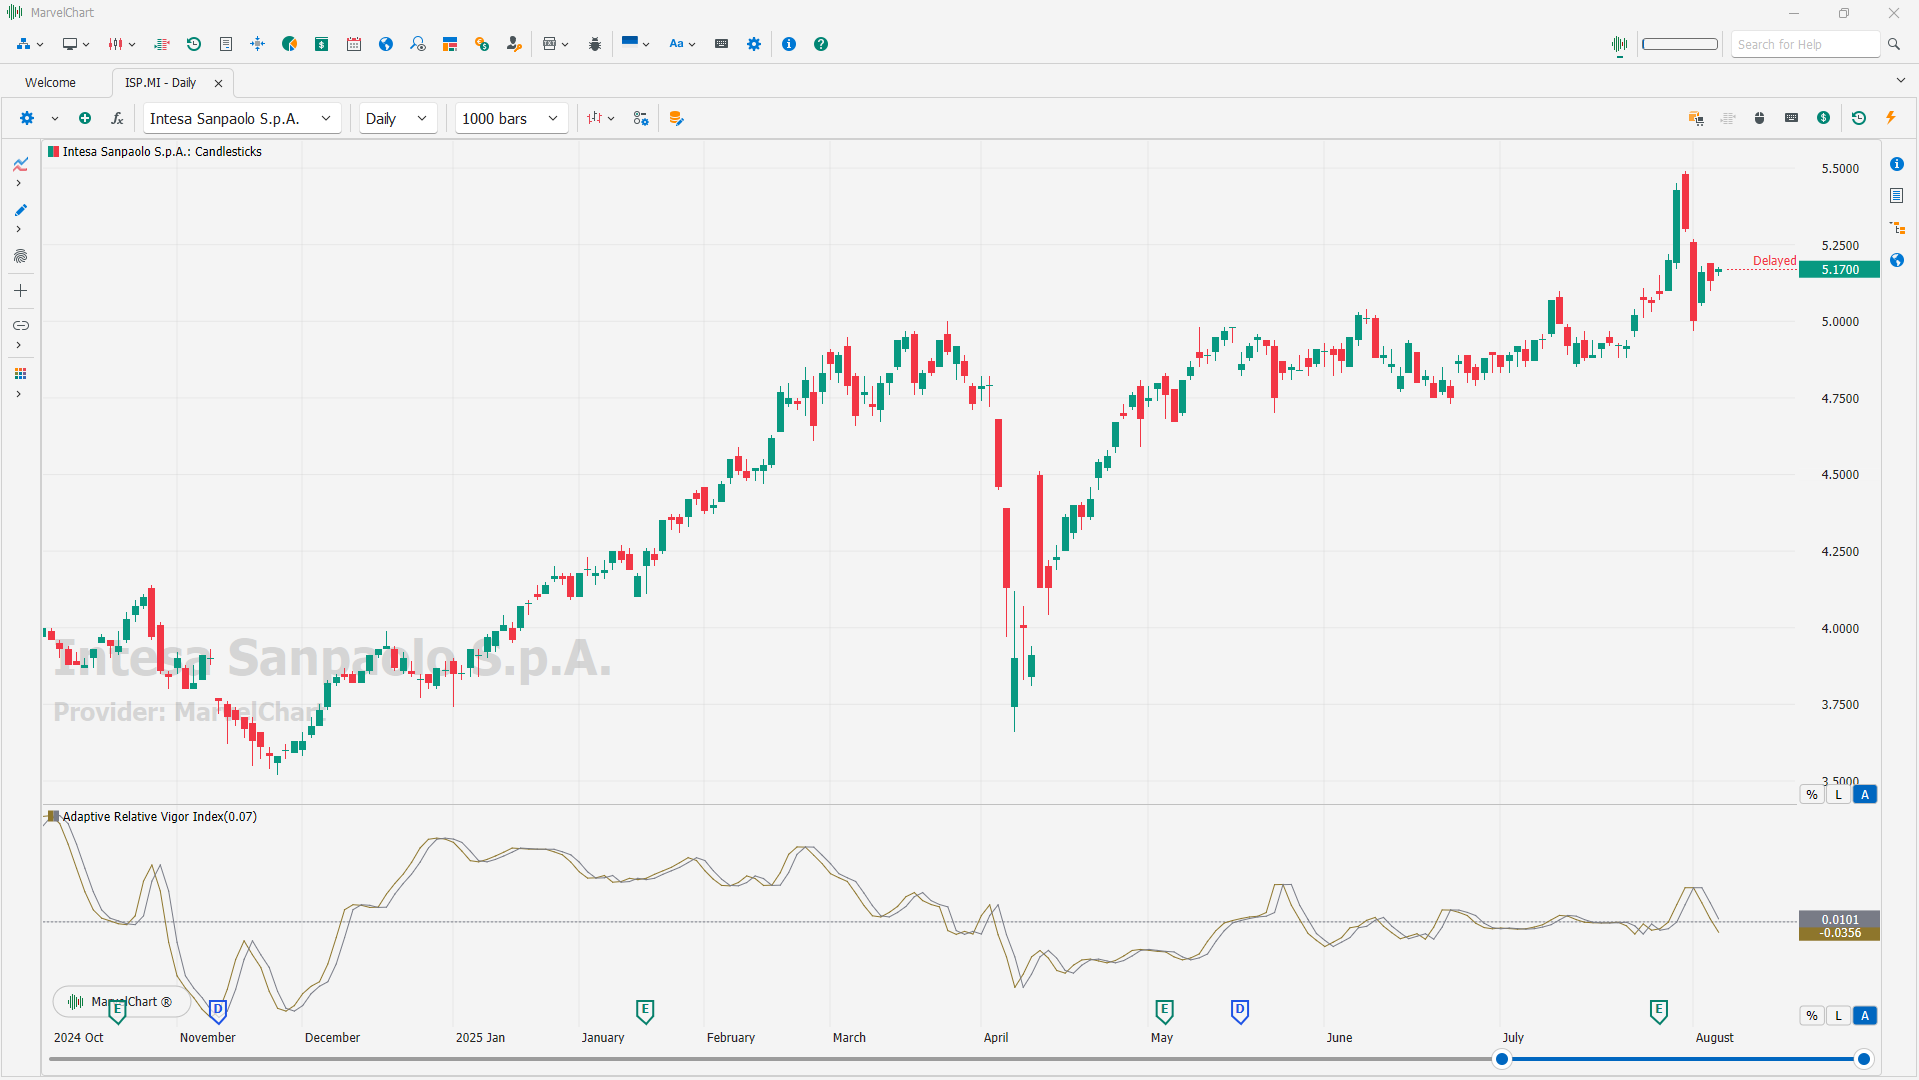
The Adaptive Relative Vigor Index (ARVI) is a technical indicator developed by John Ehlers, designed to capture the peaks and valleys of price movements by measuring the strength of a trend based on the relationship between the closing price and the trading range. It's an adaptation of the Relative Vigor Index (RVI), which itself compares closing prices to the high-low range.
Key Concepts
Relative Vigor Index (RVI)
RVI, developed by Donald Dorsey, measures the conviction of price movements by comparing the closing price to the trading range (high-low). It's based on the idea that uptrends typically close higher than they open, and downtrends close lower.
Adaptive
The "adaptive" part means the indicator adjusts its parameters (like smoothing periods) based on market conditions, potentially making it more responsive to changes.
Oscillator
RVI, and therefore ARVI, is an oscillator, meaning it fluctuates between high and low values, often used to identify overbought and oversold conditions.
Signal Line
A signal line (often a moving average of the RVI or ARVI) is used to generate trading signals when the indicator crosses above or below it.
How it Works (Conceptual)
RVI Calculation
The RVI is calculated by comparing the closing price to the opening price within a given period, and then smoothing the result with a moving average.
ARVI Adaptation
The Adaptive Relative Vigor Index adapts the RVI by dynamically adjusting its smoothing parameters based on market volatility or other factors, potentially making it more accurate in different market conditions.
Interpretation
Positive values ➤ Suggest an upward trend, with closing prices generally higher than opening prices.
Negative values ➤ Suggest a downward trend, with closing prices generally lower than opening prices.
Crossovers ➤ When the ARVI crosses above its signal line, it can signal a potential buy opportunity, and when it crosses below, it can signal a potential sell opportunity.
Divergences ➤ Discrepancies between the ARVI and price movements (e.g., price making new highs while ARVI doesn't) can be an early warning of a potential trend reversal.
How to use it
Trend Identification ➤ ARVI can help identify the strength and direction of trends.
Potential Entry/Exit Points ➤ Crossovers with the signal line can be used to generate trading signals.
Divergence Analysis ➤ Divergences between ARVI and price can signal potential trend reversals.
Combine with other indicators ➤ ARVI can be used in conjunction with other indicators for confirmation and more robust trading strategies.
Limitations
Trending Markets
ARVI, like RVI, tends to perform better in trending markets and may generate false signals in range-bound or choppy markets.
Parameter Optimization
The effectiveness of ARVI can depend on proper parameter selection (e.g., the length of the moving average used in the calculation).
Summary
Adaptive Williams %R
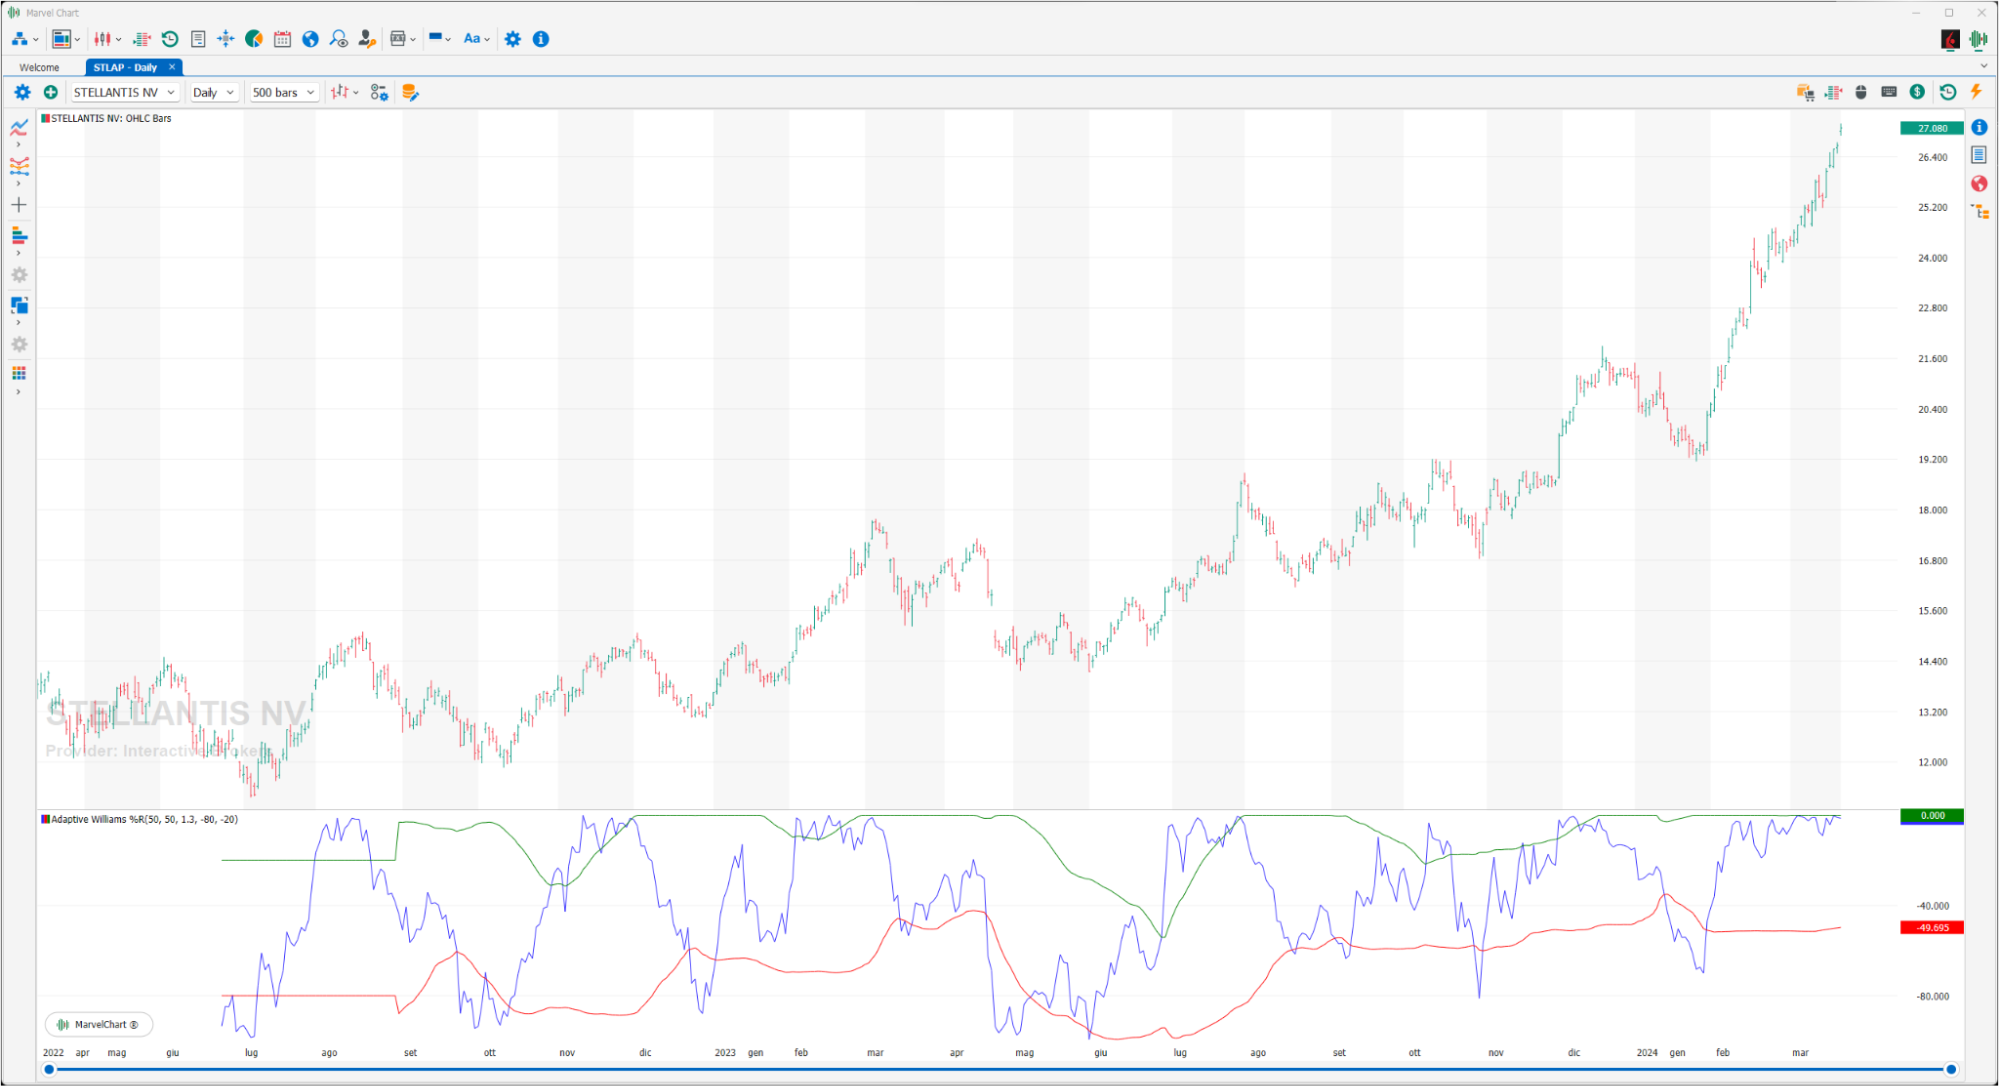
Williams %R is an indicator developed by the famous American trader Larry Williams, which oscillates between 0 and -100, practically on an inverted scale. Two extreme zones of the index are identified, but their reading occurs in a mirror manner to that of the stochastic itself. According to the author, the zones to monitor are -20 and -80. Values above -20 represent the overbought area, while values below -80 represent the oversold area. The buy signal is activated when the indicator, after falling into oversold (below -80), falls above this threshold. On the contrary, the sell signal will start when the indicator in the overbought zone (above -20) goes down and violates this threshold.